Answered step by step
Verified Expert Solution
Question
1 Approved Answer
aber of pancak - X Data Table 's monthly da mine Asokan's It how well dd Month Number of Pancakes Total Operating Costs ssion, determin
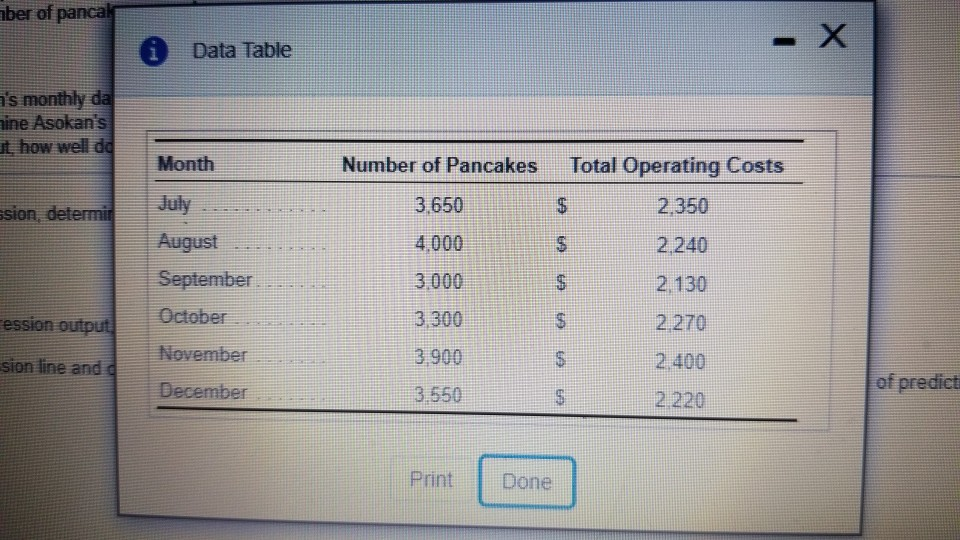
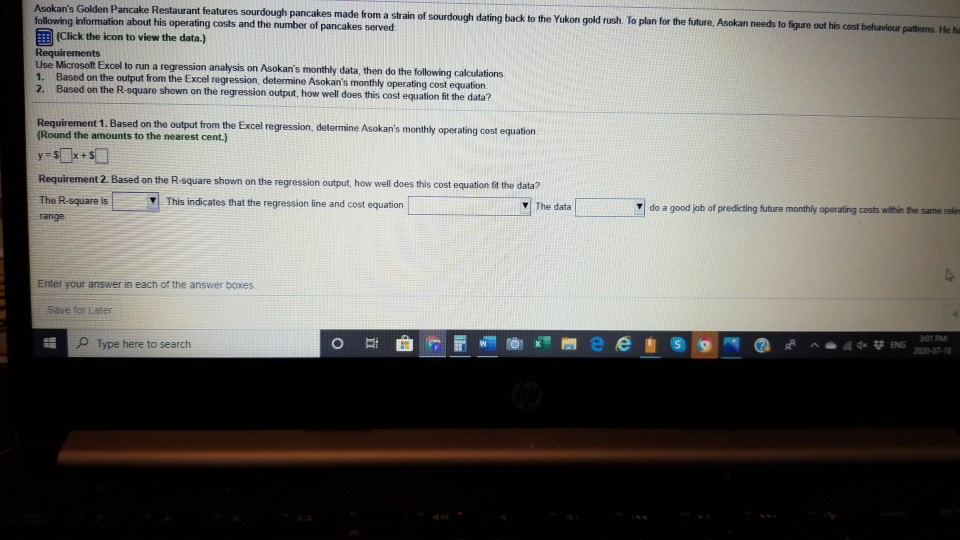
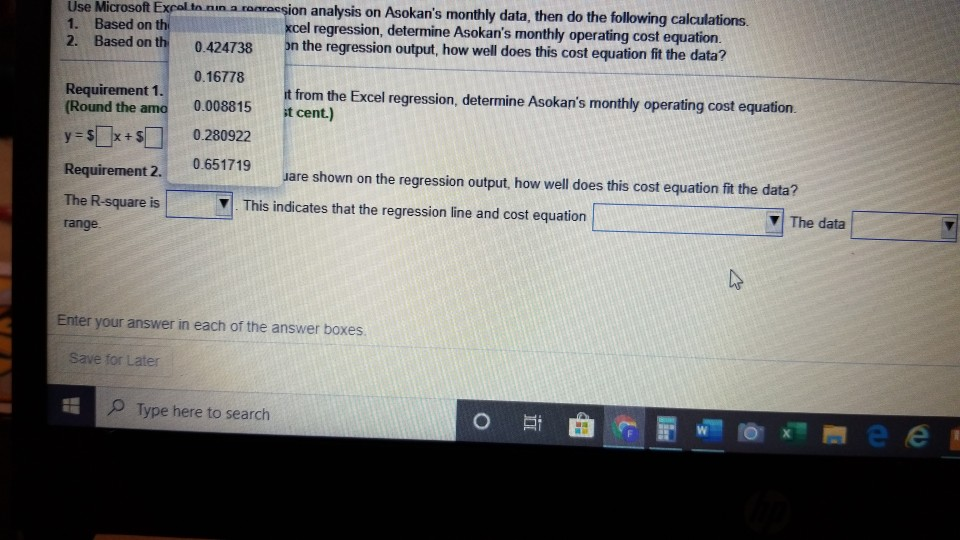
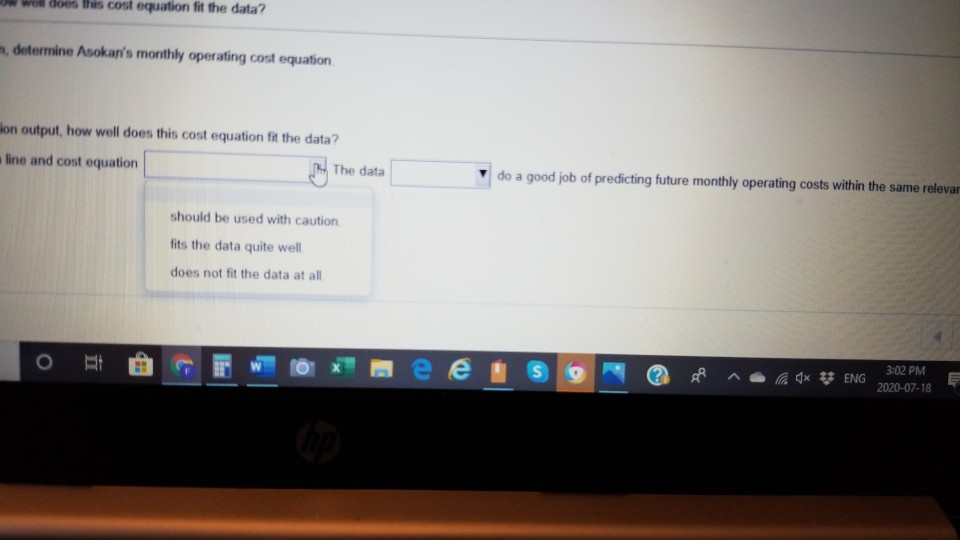
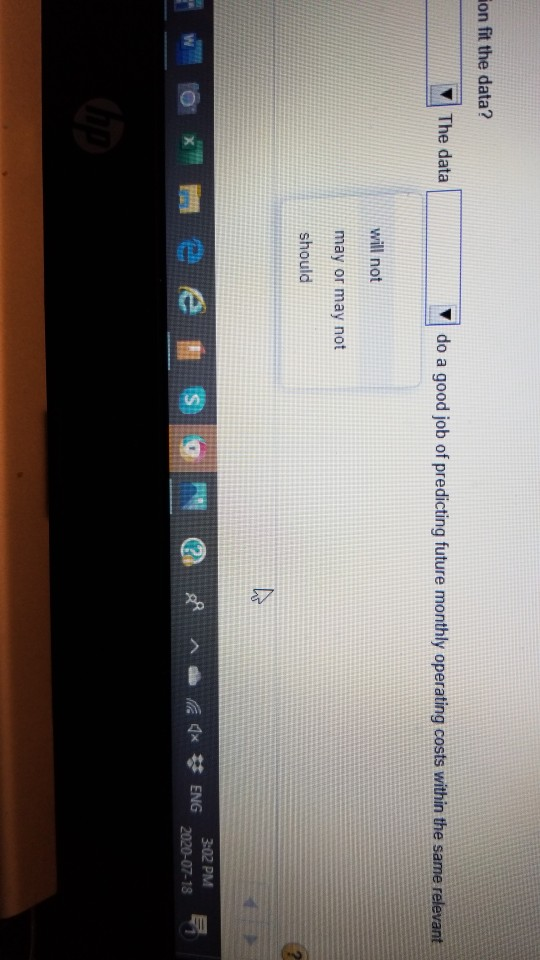
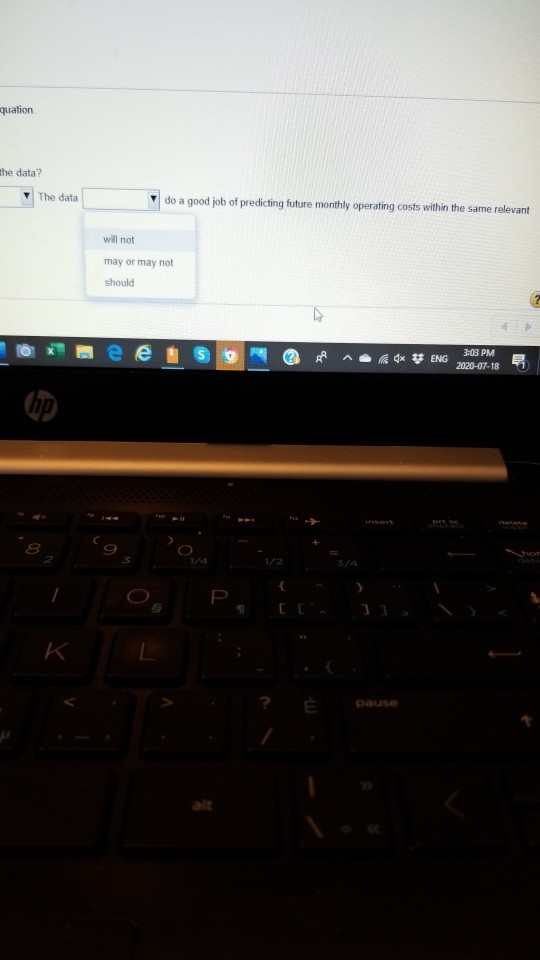
aber of pancak - X Data Table 's monthly da mine Asokan's It how well dd Month Number of Pancakes Total Operating Costs ssion, determin July 3,650 -- $ 2.350 4,000 $ 2.240 August September October 3.000 EA 2 130 Cession output 3.300 $ 2.270 November sion line and a 3.900 $ 2.400 December of predict 3.550 9 2 220 Print Done Asokan's Golden Pancake Restaurant features sourdough pancakes made from a strain of sourdough dating back to the Yukon gold rush. To plan for the future, Asokan needs to figure out his cost behaviour patterns. He he following information about his operating costs and the number of pancakes served (Click the icon to view the data.) Requirements Use Microsoft Excel to run a regression analysis on Asokan's monthly data, then do the following calculations 1. Based on the output from the Excel regression, determine Asokan's monthly operating cost equation. 2. Based on the R-square shown on the regression output, how well does this cost equation fit the data? Requirement 1. Based on the output from the Excel regression determine Asokan's monthly operating cost equation (Round the amounts to the nearest cent.) y=$_+$0 Requirement 2. Based on the R-square shown on the regression output, how well does this cost equation fit the data? The R-square is This indicates that the regression line and cost equation The data range do a good job of predicting future monthly operating costs within the same rele Enter your answer in each of the answer boxes Save for Later TE Type here to search o 301 PM BI e 0 ENG Use Microsoft Excel ta nin a ranraesion analysis on Asokan's monthly data, then do the following calculations. 1. Based on th xcel regression, determine Asokan's monthly operating cost equation. 2. Based on th 0.424738 on the regression output, how well does this cost equation fit the data? Requirement 1. (Round the amo y=$ x + 0.16778 it from the Excel regression, determine Asokan's monthly operating cost equation 0.008815 it cent.) 0.280922 0.651719 Jare shown on the regression output, how well does this cost equation fit the data? This indicates that the regression line and cost equation The data Requirement 2. The R-square is range 2 Enter your answer in each of the answer boxes. Save for Later Type here to search O e e does this cost equation fit the data? determine Asokar's monthly operating cost equation on output, how well does this cost equation fit the data? line and cost equation The data do a good job of predicting future monthly operating costs within the same relevar should be used with caution fits the data quite well does not fit the data at all o lax * ENG 3:02 PM 2020-07-18 lion fit the data? The data do a good job of predicting future monthly operating costs within the same relevant will not may or may not should h X O S op ^ di lax * ENG 3 3:02 PM 2020-07-18 quation the data? The data do a good job of predicting future monthly operating costs within the same relevant will not may or may not should 59 e x ENG 3:03 PM 2020-07-18 hp 8 P ? pause
Step by Step Solution
There are 3 Steps involved in it
Step: 1

Get Instant Access to Expert-Tailored Solutions
See step-by-step solutions with expert insights and AI powered tools for academic success
Step: 2

Step: 3

Ace Your Homework with AI
Get the answers you need in no time with our AI-driven, step-by-step assistance
Get Started


