Answered step by step
Verified Expert Solution
Question
1 Approved Answer
Accounting Analytics Your company manufactures high-quality yarn for sale at craft stores and yarn and specialty shops across the country. Specifically, your facility manufactures merino
Accounting Analytics 

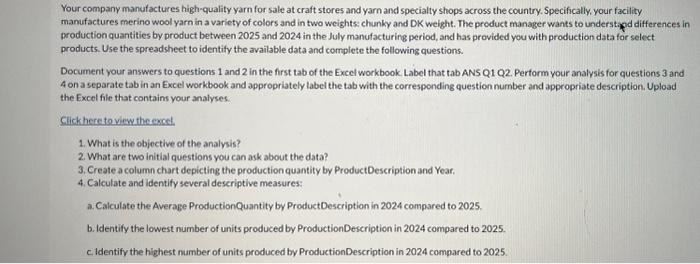
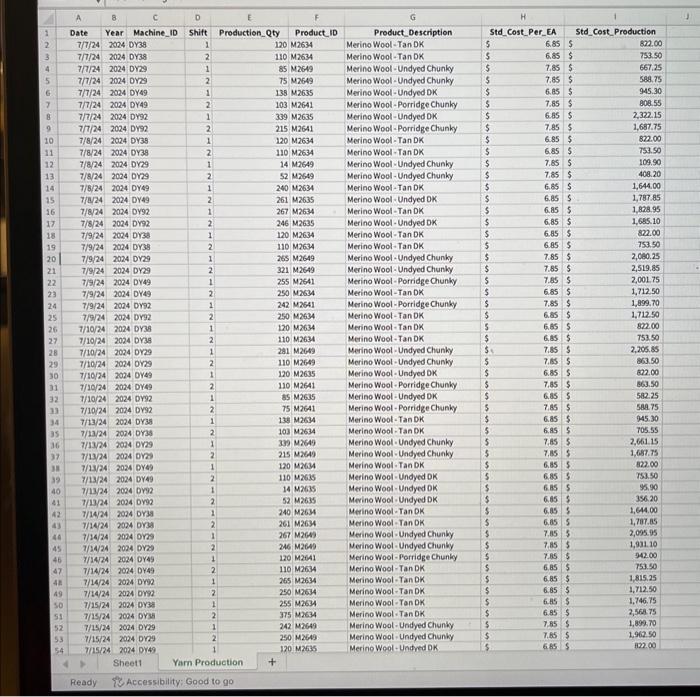
Your company manufactures high-quality yarn for sale at craft stores and yarn and specialty shops across the country. Specifically, your facility manufactures merino wool yarn in a variety of colors and in two weights: chunky and DK welght. The product manager wants to understapd differences in production quantities by product between 2025 and 2024 in the July manufacturing period, and has provided you with production data for select products. Use the spreadsheet to identify the available data and complete the following questions. Document your answers to questions 1 and 2 in the first tab of the Excel workbook Label that tab ANS Q1 Q2. Perform your analysis for questions 3 and 4 on a separate tab in an Excel workbook and appropriately label the tab with the corresponding question number and approptiate description. Upload the Excel file that contains your analyses. Click here to vin whe excel. 1. What is the objective of the analysis? 2. What are two initial questions you can ask about the data? 3. Create a column chart depicting the production quantity by ProductDescription and Year. 4. Calculate and identify several descriptive measures: a. Calculate the Average ProductionQuantity by ProductDescription in 2024 compared to 2025. b. Identify the lowest number of units produced by ProductionDescription in 2024 compared to 2025. c. Identify the highest number of units produced by ProductionDescription in 2024 compared to 2025. Your company manufactures high-quality yarn for sale at craft stores and yarn and specialty shops across the country. Specifically, your facility manufactures merino wool yarn in a variety of colors and in two weights: chunky and DK welght. The product manager wants to understapd differences in production quantities by product between 2025 and 2024 in the July manufacturing period, and has provided you with production data for select products. Use the spreadsheet to identify the available data and complete the following questions. Document your answers to questions 1 and 2 in the first tab of the Excel workbook Label that tab ANS Q1 Q2. Perform your analysis for questions 3 and 4 on a separate tab in an Excel workbook and appropriately label the tab with the corresponding question number and approptiate description. Upload the Excel file that contains your analyses. Click here to vin whe excel. 1. What is the objective of the analysis? 2. What are two initial questions you can ask about the data? 3. Create a column chart depicting the production quantity by ProductDescription and Year. 4. Calculate and identify several descriptive measures: a. Calculate the Average ProductionQuantity by ProductDescription in 2024 compared to 2025. b. Identify the lowest number of units produced by ProductionDescription in 2024 compared to 2025. c. Identify the highest number of units produced by ProductionDescription in 2024 compared to 2025 

Step by Step Solution
There are 3 Steps involved in it
Step: 1

Get Instant Access to Expert-Tailored Solutions
See step-by-step solutions with expert insights and AI powered tools for academic success
Step: 2

Step: 3

Ace Your Homework with AI
Get the answers you need in no time with our AI-driven, step-by-step assistance
Get Started


