

Question: Segment (Division) Evaluation In this assignment you will analyze the performance of PepsiCo's divisions. SFAS 131 requires publicly traded companies to disclose division information
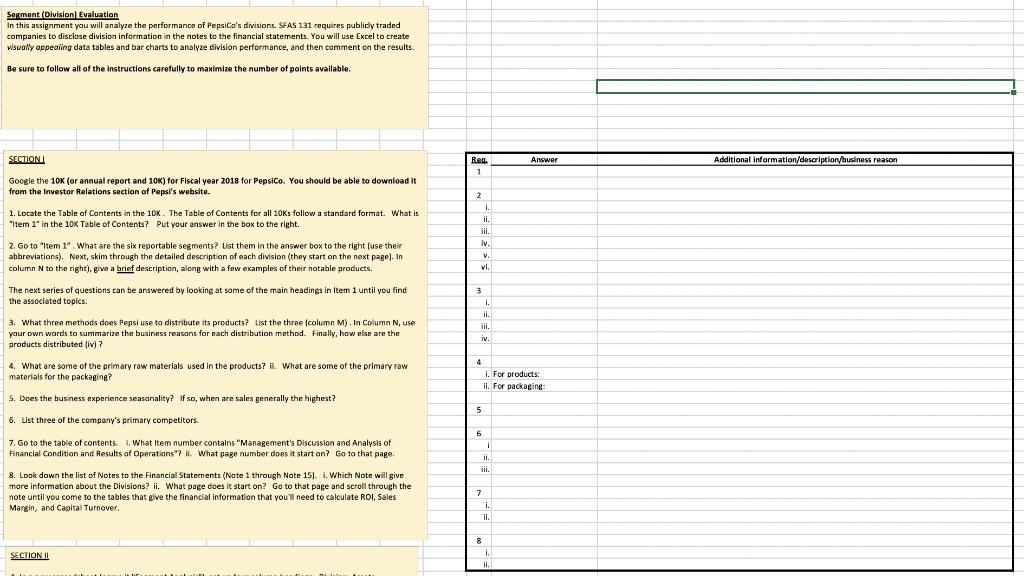
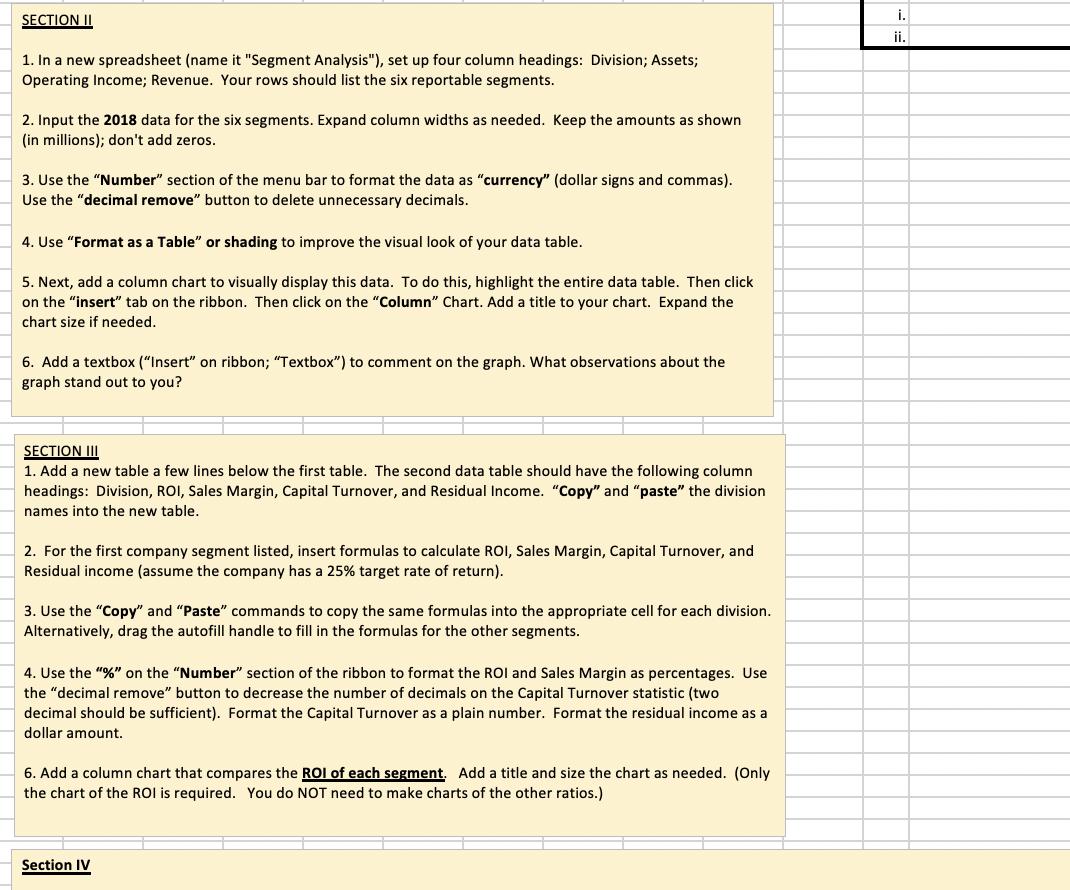
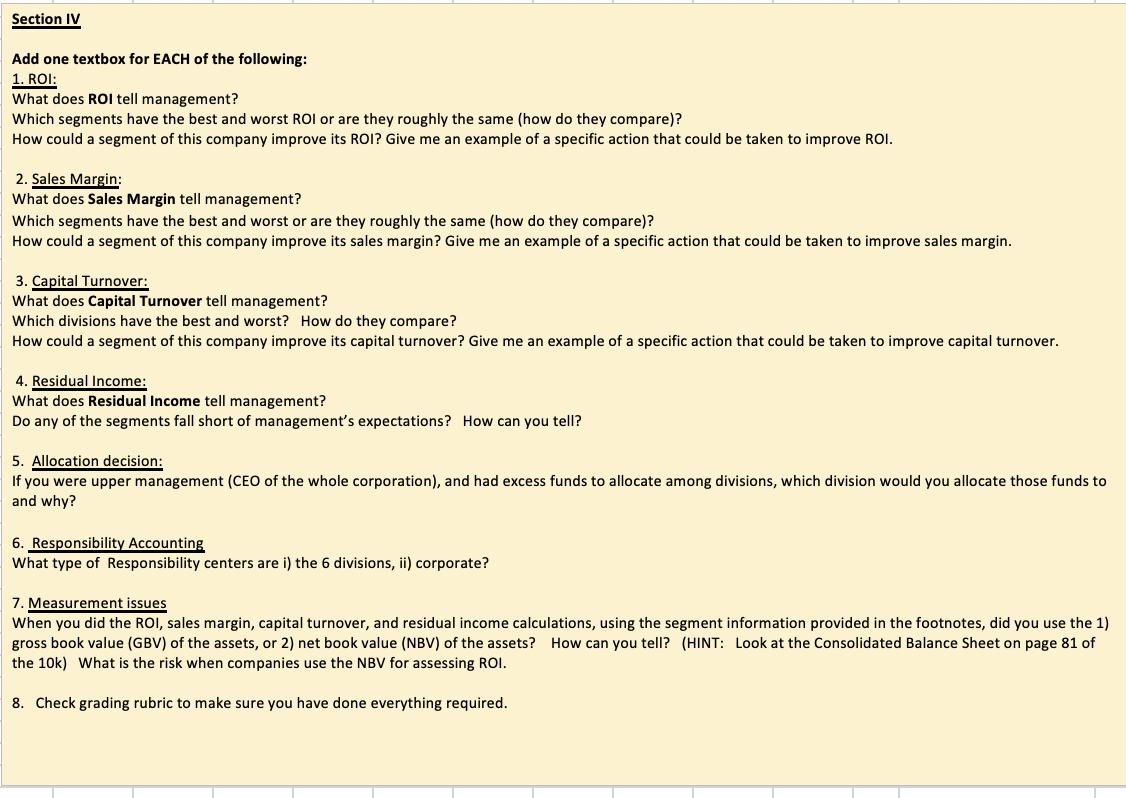
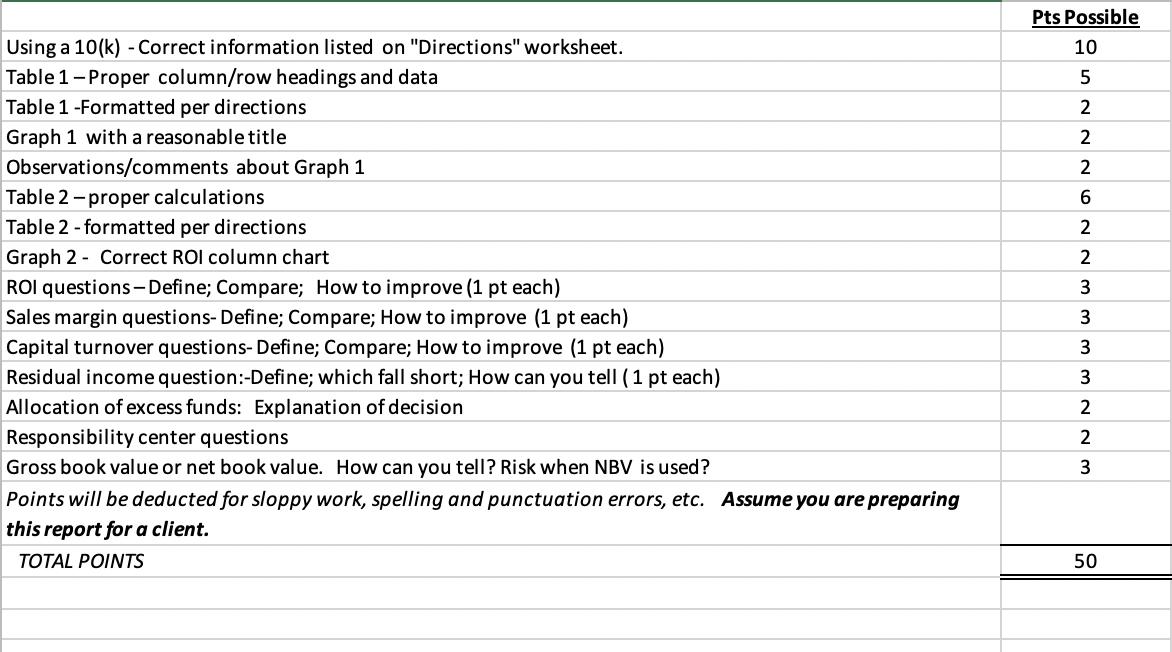
Segment (Division) Evaluation In this assignment you will analyze the performance of PepsiCo's divisions. SFAS 131 requires publicly traded companies to disclose division information in the notes to the financial statements. You will use Excel to create visually appealing data tables and bar charts to analyze division performance, and then comment on the results. Be sure to follow all of the instructions carefully to maximize the number of points available. SECTIONI Google the 10k (or annual report and 10K) for Fiscal year 2018 for PepsiCo. You should be able to download it from the Investor Relations section of Pepsi's website. 1. Locate the Table of Contents in the 10K. The Table of Contents for all 10Ks follow a standard format. What is "Item 1" in the 10K Table of Contents? Put your answer in the box to the right. 2. Go to "Item 1. What are the six reportable segments? List them in the answer box to the right [use their abbreviations). Next, skim through the detailed description of each division (they start on the next page). In column N to the right), give a brief description, along with a few examples of their notable products. The next series of questions can be answered by looking at some of the main headings in Item 1 until you find the associated topics. 3. What three methods does Pepsi use to distribute its products? List the three (column M). In Column N, use your own words to summarize the business reasons for each distribution method. Finally, how else are the products distributed (iv)? 4. What are some of the primary raw materials used in the products? ii. What are some of the primary raw materials for the packaging? 5. Does the business experience seasonality? If so, when are sales generally the highest? 6. List three of the company's primary competitors. 7. Go to the table of contents. i. What Item number contains "Management's Discussion and Analysis of Financial Condition and Results of Operations"? il. What page number does it start on? Go to that page. 8. Look down the list of Notes to the Financial Statements (Note 1 through Note 15). i. Which Note will give more information about the Divisions? ii. What page does it start on? Go to that page and scroll through the note until you come to the tables that give the financial information that you'll need to calculate ROI, Sales Margin, and Capital Turnover. SECTION !! Reg. 1 2 iii. iv. 3 vi. 4 & i. ii. V. ii. iii. TV. 5 6 7 1. 8 i. For products: ii. For packaging: F ii. i. ii. Answer 1. II. Additional information/description/business reason SECTION II 1. In a new spreadsheet (name it "Segment Analysis"), set up four column headings: Division; Assets; Operating Income; Revenue. Your rows should list the six reportable segments. 2. Input the 2018 data for the six segments. Expand column widths as needed. Keep the amounts as shown (in millions); don't add zeros. 3. Use the "Number" section of the menu bar to format the data as "currency" (dollar signs and commas). Use the "decimal remove" button to delete unnecessary decimals. 4. Use "Format as a Table" or shading to improve the visual look of your data table. 5. Next, add a column chart to visually display this data. To do this, highlight the entire data table. Then click on the "insert" tab on the ribbon. Then click on the "Column" Chart. Add a title to your chart. Expand the chart size if needed. 6. Add a textbox ("Insert" on ribbon; "Textbox") to comment on the graph. What observations about the graph stand out to you? SECTION III 1. Add a new table a few lines below the first table. The second data table should have the following column headings: Division, ROI, Sales Margin, Capital Turnover, and Residual Income. "Copy" and "paste" the division names into the new table. 2. For the first company segment listed, insert formulas to calculate ROI, Sales Margin, Capital Turnover, and Residual income (assume the company has a 25% target rate of return). 3. Use the "Copy" and "Paste" commands to copy the same formulas into the appropriate cell for each division. Alternatively, drag the autofill handle to fill in the formulas for the other segments. 4. Use the "%" on the "Number" section of the ribbon to format the ROI and Sales Margin as percentages. Use the "decimal remove" button to decrease the number of decimals on the Capital Turnover statistic (two decimal should be sufficient). Format the Capital Turnover as a plain number. Format the residual income as a dollar amount. 6. Add a column chart that compares the ROI of each segment. Add a title and size the chart as needed. (Only the chart of the ROI is required. You do NOT need to make charts of the other ratios.) Section IV i. ii. Section IV Add one textbox for EACH of the following: 1. ROI: What does ROI tell management? Which segments have the best and worst ROI or are they roughly the same (how do they compare)? How could a segment of this company improve its ROI? Give me an example of a specific action that could be taken to improve ROI. 2. Sales Margin: What does Sales Margin tell management? Which segments have the best and worst or are they roughly the same (how do they compare)? How could a segment of this company improve its sales margin? Give me an example of a specific action that could be taken to improve sales margin. 3. Capital Turnover: What does Capital Turnover tell management? Which divisions have the best and worst? How do they compare? How could a segment of this company improve its capital turnover? Give me an example of a specific action that could be taken to improve capital turnover. 4. Residual Income: What does Residual Income tell management? Do any of the segments fall short of management's expectations? How can you tell? 5. Alloca decision If you were upper management (CEO of the whole corporation), and had excess funds to allocate among divisions, which division would you allocate those funds to and why? 6. Responsibility Accounting What type of Responsibility centers are i) the 6 divisions, ii) corporate? 7. Measurement issues When you did the ROI, sales margin, capital turnover, and residual income calculations, using the segment information provided in the footnotes, did you use the 1) gross book value (GBV) of the assets, or 2) net book value (NBV) of the assets? How can you tell? (HINT: Look at the Consolidated Balance Sheet on page 81 of the 10k) What is the risk when companies use the NBV for assessing ROI. 8. Check grading rubric to make sure you have done everything required. Using a 10(k) - Correct information listed on "Directions" worksheet. Table 1-Proper column/row headings and data Table 1 -Formatted per directions Graph 1 with a reasonable title Observations/comments about Graph 1 Table 2-proper calculations Table 2 -formatted per directions Graph 2 Correct ROI column chart ROI questions - Define; Compare; How to improve (1 pt each) Sales margin questions- Define; Compare; How to improve (1 pt each) Capital turnover questions- Define; Compare; How to improve (1 pt each) Residual income question:-Define; which fall short; How can you tell (1 pt each) Allocation of excess funds: Explanation of decision Responsibility center questions Gross book value or net book value. How can you tell? Risk when NBV is used? Points will be deducted for sloppy work, spelling and punctuation errors, etc. Assume you are preparing this report for a client. TOTAL POINTS Pts Possible 10 W N N w w w w N NaN NNSO 5 2 2 2 2 3 3 3 3 3 50
Step by Step Solution
3.41 Rating (160 Votes )
There are 3 Steps involved in it

Get step-by-step solutions from verified subject matter experts