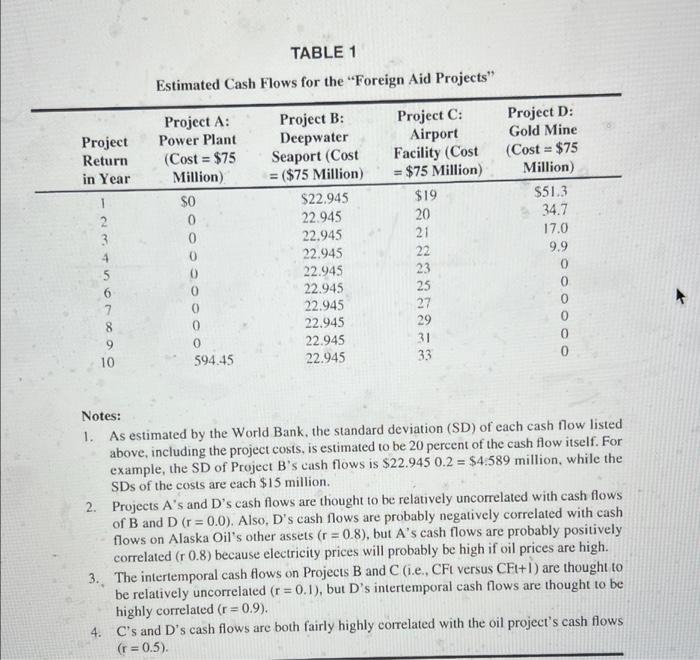
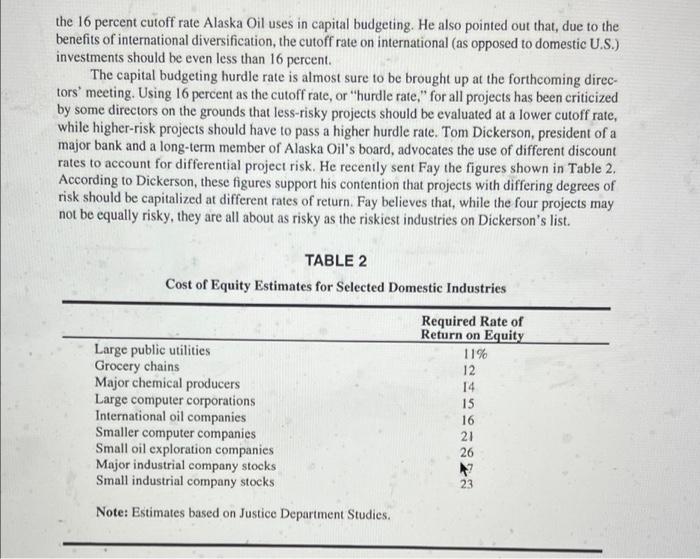
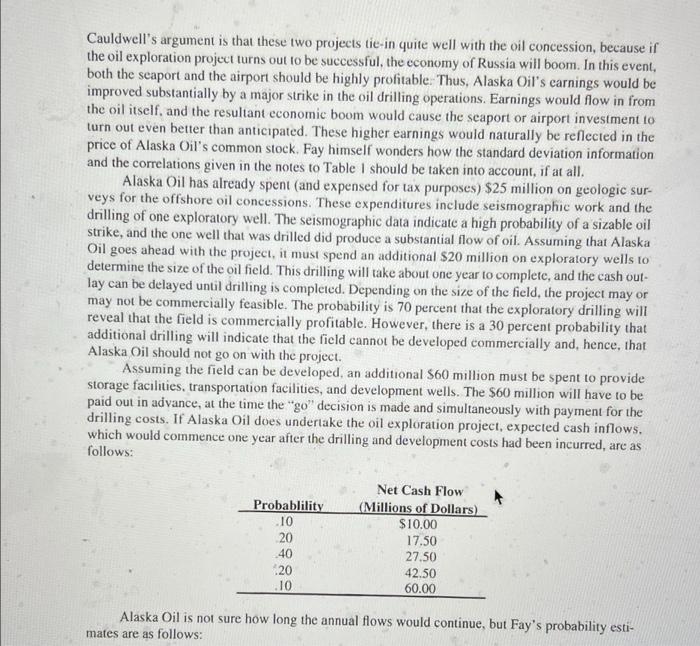
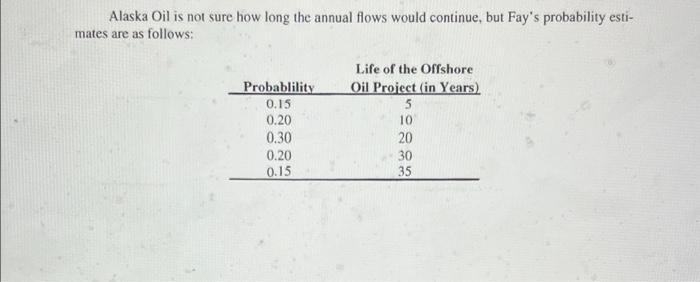
Alaska Oil Corporation Capital Budgeting Directed David Fay, Alaska Oil's financial vice president, is preparing a report for the monthly directors' meeting. An important issue is on the agenda, a project which some of the directors have called "the foreign aid project." The government of Russia has agreed to give Alaska Oil Exploration, the oil drilling subsidiary of Alaska Oil, some important offshore oil concessions, provided Alaska Oil agrees to undertake at least one of the four investment projects listed in Table 1. Project A involves the development and construction of a power plant which, although it will not be completed and thus not produce any income for ten years, is expected to be worth approximately $594.45 million at the end of the tenth year. Project B, the construction of a deepwater seaport facility, has expected rev- enues of $22.945 million per year. Project C calls for the construction and operation of an airport facility from which revenues should increase as Russia's economic development progresses. Finally, Project D involves the development of a gold mining operation in central Siberia. D's revenues will be highest in the first year, but the ore body will be completely exhausted after four years. The projects' cash flows, standard deviations, and correlation coefficients as set forth in Table 1 were all developed by the World Bank, an organization supported by the United States and other industrialized nations to finance economic development in Third-World countries. The World Bank economists, who took the potential oil resources into consideration when they made their study, judged all four projects to be economically feasible. Although the projects admittedly carry a high degree of risk, the Bank is willing to finance any of them. However, the Bank's funds are sufficient to lend the Russian government the amounts necessary to complete only three of the four projects. Russia has therefore tied the granting of its oil concessions to Alaska Oil's taking on one or more of the listed projects. TABLE 1 Estimated Cash Flows for the "Foreign Aid Projects" Project Return in Year Project A: Power Plant (Cost = $75 Million) SO 0 0 0 0 0 0 0 0 594.45 1 2 3 4 5 6 7 Project B: Deepwater Seaport (Cost = ($75 Million) $22.945 22.945 22.945 22.945 22.945 22.945 22.945 22.945 22.945 22.945 Project C: Airport Facility (Cost - $75 Million) $19 20 21 22 23 25 27 29 31 33 Project D: Gold Mine (Cost = $75 Million) $51.3 34.7 17.0 9.9 0 0 9 10 0 Notes: 1. As estimated by the World Bank, the standard deviation (SD) of each cash flow listed above, including the project costs, is estimated to be 20 percent of the cash flow itself. For example, the SD of Project B's cash flows is $22.945 0.2 = $4.589 million, while the SDs of the costs are each $15 million. 2. Projects A's and D's cash flows are thought to be relatively uncorrelated with cash flows of B and D (r = 0.0). Also, D's cash flows are probably negatively correlated with cash flows on Alaska Oil's other assets (r = 0.8), but A's cash flows are probably positively correlated (r 0.8) because electricity prices will probably be high if oil prices are high. 3. The intertemporal cash flows on Projects B and C (i.e., CFt versus CFt+l) are thought to be relatively uncorrelated (r = 0.1), but D's intertemporal cash flows are thought to be highly correlated (r=0.9). 4. C's and D's cash flows are both fairly highly correlated with the oil project's cash flows (r = 0.5). As noted above, some of Alaska Oil's directors consider the four projects to amount to foreign aid. They think that the costs are probably underestimated and the projected cash flows overesti- mated, with the result being that Alaska Oil would lose heavily on any project it undertakes. How- ever, other directors are impressed with the research done by the World Bank's economists, whose report hinted that the projects' costs are very conservatively estimated and that revenues may well run double those shown in the table. Fay has tentatively concluded (1) that the projects all carry considerable risk, and (2) that no one of them is obviously better than any other. Some board members would prefer not to undertake any of the projects and therefore, not to accept the oil concessions. A majority of the board, how- ever, tentatively favor taking on one of the projects in order to obtain the concessions. Several board members have even suggested that all of the projects look interesting, and, given Alaska Oil's excess cash flows and unused debt capacity, will probably suggest that Alaska Oil take on more than one of the projects. A spokesman for this group recently sent Fay a memorandum indicating that, according to some rough estimates, each of the listed projects has a rate of return in excess of the 16 percent cutoff rate Alaska Oil uses in capital budgeting. He also pointed out that, due to the benefits of international diversification, the cutoff rate on international (as opposed to domestic U.S.) investments should be even less than 16 percent. The capital budgeting hurdle rate is almost sure to be brought up at the forthcoming direc- tors' meeting. Using 16 percent as the cutoff rate, or "hurdle rate," for all projects has been criticized by some directors on the grounds that less-risky projects should be evaluated at a lower cutoff rate, while higher-risk projects should have to pass a higher hurdle rate. Tom Dickerson, president of a major bank and a long-term member of Alaska Oil's board, advocates the use of different discount rates to account for differential project risk. He recently sent Fay the figures shown in Table 2. According to Dickerson, these figures support his contention that projects with differing degrees of risk should be capitalized at different rates of return. Fay believes that, while the four projects may not be equally risky, they are all about as risky as the riskiest industries on Dickerson's list. TABLE 2 Cost of Equity Estimates for Selected Domestic Industries Large public utilities Grocery chains Major chemical producers Large computer corporations International oil companies Smaller computer companies Small oil exploration companies Major industrial company stocks Small industrial company stocks Required Rate of Return on Equity 11% 12 14 15 16 21 26 23 Note: Estimates based on Justice Department Studies. The riskiness of international as opposed to domestic (U.S.) investments has also been ques- tioned. One group of directors has argued that international diversification lowers risk; hence, for- eign projects should be evaluated with a lower cost of capital. However, another group takes the opposite view, arguing that the combination of exchange rate risk and the risk of expropriation makes foreign investments far riskier. Fay himself thinks that the location of the investment is the key factor-investments in Western Europe may well be less risky because of the diversification fac- tor, but those in Russia are, in his view, quite another thing. Alaska Oil uses 40 percent debt in its capital structure, but it finances Alaska Oil Exploration only with equity because of the risks inherent in wildcat oil drilling. Fay believes that the exploration company's equity risk is similar to that of the parent company, because the parent's equity is lever- aged, but the exploration company's equity is not. Thus, 16 percent is the estimated cost of equity to the parent, but that same number is both the cost of equity and the WACC to the subsidiary. This rate is used to evaluate average-risk projects; higher or lower rates are used for more or less risky investments Another recommendation Fay must consider as he completes his report came in a telephone call from his boss, Doug Cauldwell, president of Alaska Oil. Cauldwell suggested that, assuming Alaska Oil does undertake one of the projects in order to obtain the oil concessions, the project should be either B, the deepwater seaport, or C, the airport installation. Cauldwell's argument is that these two projects tie-in quite well with the oil concession, because if the oil exploration project turns out to be successful, the economy of Russia will boom. In this event, both the seaport and the airport should be highly profitable. Thus, Alaska Oil's carnings would be improved substantially by a major strike in the oil drilling operations. Earnings would flow in from the oil itself, and the resultant economic boom would cause the seaport or airport investment to turn out even better than anticipated. These higher earnings would naturally be reflected in the price of Alaska Oil's common stock. Fay himself wonders how the standard deviation information and the correlations given in the notes to Table I should be taken into account, if at all. Alaska Oil has already spent and expensed for tax purposes) $25 million on geologic sur- veys for the offshore oil concessions. These expenditures include seismographic work and the drilling of one exploratory well. The seismographic data indicate a high probability of a sizable oil strike, and the one well that was drilled did produce a substantial flow of oil. Assuming that Alaska Oil goes ahead with the project, it must spend an additional $20 million on exploratory wells to determine the size of the oil field. This drilling will take about one year to complete, and the cash out- lay can be delayed until drilling is completed. Depending on the size of the field, the project may or may not be commercially feasible. The probability is 70 percent that the exploratory drilling will reveal that the field is commercially profitable. However, there is a 30 percent probability that additional drilling will indicate that the field cannot be developed commercially and, hence, that Alaska Oil should not go on with the project. Assuming the field can be developed, an additional S60 million must be spent to provide storage facilities, transportation facilities, and development wells. The $60 million will have to be paid out in advance, at the time the "go" decision is made and simultaneously with payment for the drilling costs. If Alaska Oil does undertake the oil exploration project, expected cash inflows. which would commence one year after the drilling and development costs had been incurred, are as follows: Probablility .10 20 40 20 .10 Net Cash Flow (Millions of Dollars) $10.00 17.50 27.50 42.50 60.00 Alaska Oil is not sure how long the annual flows would continue, but Fay's probability esti- mates are as follows: Alaska Oil is not sure how long the annual flows would continue, but Fay's probability esti- mates are as follows: Probablility 0.15 0.20 0.30 0.20 0.15 Life of the Offshore Oil Project (in Years). 5 10 20 30 35 Because of the obvious uncertainties in the offshore venture, Fay regards this project as being more risky than the average project taken on by the company. Also, the oil project's cash flows will be positively correlated with Alaska Oil's other cash flows (r=0.7). Alaska Oil must commit itself to a "foreign aid" project before it can go ahead with the addi- tional exploratory wells-it cannot wait until the results of the exploratory drilling are available before deciding on the "foreign aid" project. Therefore, if the company is to continue with the off- shore oil concession project, it must commit itself to at least one of the four projects at this time. Fay is concerned about a technical issue. Alaska Oil's financial staff has been debating the merits of the modified internal rate of return (MIRR) vis-a-vis the regular IRR and the period used to calculate MIRR. Fay regards the issue as pretty well settled that MIRR is generally superior to IRR, but he is concerned about what to do when two projects being compared have different lives, as is true for Project D versus the other projects. Should the calculated MIRR for the shorter-life pro- ject be based on its own life, or should the analysis be extended out to the end of the longer-life projects' lives? To illustrate the problem, Fay had been looking at a simple project with a cost of $10 and cash flows of $7 per year for two years, evaluated at a 10 percent cost of capital. The MIRR for the project is 21.24 percent based on its two-year life. However, if the project were being com- pared with a 10-year project, one could calculate the 2-year project's MIRR based on a 10 year time horizon; in this case, MIRR = 12.16%. Some of the staff argued for one procedure, while oth- ers argued for the alternative. The issue is relevant to the current decision, because Project D's life is shorter than those of the other projects. As he was starting to analyze the available information, Fay recalled an experience he had with another World Bank project last year-the Bank had provided a lot of information, but some of it was contradictory. This had forced Fay to decide which of the "facts" were correct. Fay wondered if that same situation might not exist in the present case, either with regard to World Bank data or to other data in the case. QUESTIONS 1. How should Alaska Oil use the information in Table 2 when deciding whether or not to select a project? 2. Calculate the expected internal rate of return and modified internal rate of return (MIRR) on the offshore oil project using both 16 percent and 26 percent as the appropriate cost of capi. tal for the project. Should the $25 million spent on geologic surveys be included in the anal- ysis? Assume for simplicity that all outlays are made immediately and that inflows begin one year from now. 3. Assuming Alaska Oil undertakes one of the four projects, calculate both the regular internal rates of return and the modified internal rates of return for Projects B and D. The regular IRRs are 23 and 27 percent for Projects A and C, respectively, and their MIRRs are 23 per- cent and 20.8 percent when compounded at 16 percent and, 23 percent and 26.4 percent when compounded at 26 percent. For these projects, are the regular or the modified IRRS more meaningful, or does it matter given that the projects are not mutually exclusive? Should D's MIRR be based on its own 4-year life or on the longer lives of the comparison projects? Based on your answers to this point, which foreign aid project, if any, should Alaska Oil accept? QUESTIONS 1. How should Alaska Oil use the information in Table 2 when deciding whether or not to select a project? 2. Calculate the expected internal rate of return and modified internal rate of return (MIRR) on the offshore oil project using both 16 percent and 26 percent as the appropriate cost of capi. tal for the project. Should the $25 million spent on geologic surveys be included in the anal- ysis? Assume for simplicity that all outlays are made immediately and that inflows begin one year from now. 3. Assuming Alaska Oil undertakes one of the four projects, calculate both the regular internal rates of return and the modified internal rates of return for Projects B and D. The regular IRRs are 23 and 27 percent for Projects A and C, respectively, and their MIRRs are 23 per- cent and 20.8 percent when compounded at 16 percent and, 23 percent and 26.4 percent when compounded at 26 percent. For these projects, are the regular or the modified IRRS more meaningful, or does it matter given that the projects are not mutually exclusive? Should D's MIRR be based on its own 4-year life or on the longer lives of the comparison projects? Based on your answers to this point, which foreign aid project, if any, should Alaska Oil accept? 4. How do (a) the timing patterns. (b) the correlations of the cash flows across projects, (c) the intertemporal correlations, and (d) the country in which the investments are located affect the relative riskiness of the projects? 5. Calculate the expected rate of return to Alaska Oil it it accepts either Project B or Project D. in combination with the oil drilling project. Undertaking Project A and the oil project yields a combined IRR of 26 25 percent, and for Project C plus the oil venture, this value is 30.21 percent. Based on these calculations, which project, if any, should Alaska Oil accept? 6. Fay thinks that while the data in Table 2 may be relevant for industries in the United States, the values do not adequately reflect the degree of risk inherent in international projects. Accordingly, he plans to use the capital asset pricing model (CAPM) to adjust for differen- tial risk: ti k KRE+ (km-koby = 8% + (15%-8%)b = 8% + (7%), Here. k risk-adjusted discount rate appropriate for th project KRE = risk-free rate of interest: Fay uses 8 percent based on U.S. Treasury bond yields. expected return on the market." Fay uses an historical figure of 15 percent. bi beta coefficient of the ith project: these values must be subjectively estimated, The World Bank analysis estimated the beta coefficients for each project as follows: ku Project A B D Oil Project Beta Coefficient 2.50 3.25 3.00 2.75 3.00 Alaska Oil's overall beta (with the market)is 1.143. Given this information, calculate the risk-adjusted discount rates for Alaska Oil, the oil exploration project, and Projects B and D. For Projects A and C, the values are 25.5 and 29 percent, respectively. Note that Alaska Oil's own beta was calculated without regard to the effects of any of these projects. 7. Alicia Fernandez, president of Friends of Russia (a UN-sponsored organization) and a direc- tor of Alaska Oil, has called Fay's attention to the hurdle rate of 16 percent (the cost of capi tal currently used for all projects). Since the IRRs of all five projects exceed 16 percent, she asks why, especially in view of Alaska Oil's ample cash flows and funds available for investment, all of the projects should not be accepted? Fay, like Dickerson, disagrees with this thinking, contending that none of the foreign aid projects gives Alaska Oil an ade quate return for the amount of risk the company would be taking. Fay plans to support his position by referring to Figure I, which shows that while all four projects' returns lie above the line representing the subsidiary's weighted average cost of capital they are below the The Security Market Line of the CAPM is used to estimate the required rate of return on equity. Since the cash flows developed in Table i represent only those flows that can be repatriated to the parent fim, all expenses, including interest costs on World Bank debt, have been deducted. Thus, the net cash flows are cash flows to equity holder and the appropriate hur dle rate is the cost of equity rather than the weighted average cost of capital Security Market Line (SML), which represents the minimum rate of return that a firm should require for a specified amount of risk. For example, Project A's beta coefficient is 2.50, so the minimum expected return that would make the project acceptable is 25.5 per- cent. Since the project's expected return is only 23 percent, the firm is not receiving ade- quate compensation for the amount of risk inherent in the investment, and, if accepted, the project would raise the firm's cost of capital. On the other hand, the oil project has a beta of 3.0, a required return of 29 percent, and an expected return of 33.77 percent. Since the expected return exceeds the risk-adjusted required rate of return (the project's own cost of equity), it apparently should be accepted. Of course, the oil project cannot be accepted unless one of the foreign aid" projects is accepted in conjunction with it. Therefore, calculate for Fay the weighted average beta coefficients for Projects B and D in conjunction with the oil drilling project. For Projects A and C. each combined with the oil project, the weighted beta coefficients are 2.73 and 3.00, respectively. Which combination of projects should be accepted? (Hint: plot these values, along with those found in Question 5, on Figure 1 to better illustrate the relative positions of the investment proposals.) Return 0.40 0.35 L1 1 Oil A 0.30 0.25 : 0.20 0.15 0.10 0.05 0.00 0.00 0.50 1.00 1.50 2.00 2.50 3.00 3.50 4.00 Figure 1 Risk Return Graph 8. Often, due to its ample operating cash flows, Alaska Oil has excess cash on hand over and above the amount required for daily operations. Fay invests these excesses in marketable securities rather than holding them as cash. Fay has thoroughly investigated one such poten- tial investment (not previously discussed in the case). Nockahoma Electronics Corporation, a Japanese company with a tight cash position due to its recent expansion program, requires a loan of $50 million. Nockahoma recently contacted Fay in hopes of borrowing the funds from Alaska Oil. After determining that his company has sufficient funds to meet the loan request, Fay esti- mated that this investment would have a beta coefficient of 0.5, while it would earn a return of 15 percent. He felt that the beta of 0.5 was appropriate for several reasons: (1) Fay has had a long history of successful dealings with Nockahoma: (2) Nockahoma is a very stable, profitable firm; (3) the loan can be called for repayment any time rates indicate a deteriorat- ing situation, and (4) the loan will be secured by some liquid, safe assets owned by Nocka- homa. In combination, these factors make the loan a very low-risk investment proposal. The problem Fay faces is that, although the Nockahoma proposal has a very small amount of risk and a return in excess of that required by the SML, the percentage return lies below the average cost of capital (or hurdle rate) of 16 percent that Alaska Oil Exploration presently employs. Fay sees this as an excellent opportunity to illustrate the desirability of using risk-adjusted discount rates rather than a constant discount rate for project selection Fay plans to point out that none of the individual "foreign aid" projects should be accepted, as their returns are not sufficient for the high degree of risk involved. Only when these individual projects are combined with the oil drilling project do some of them offer sufficient return to compensate for their risk. With the same argument, Fay contends that the Nockahoma loan should be accepted, as its return is in excess of the required rate of 11.5 percent read from the SML Should Alaska Oil make the $50 million loan to Nockahoma? Plot the loan, along with the oil project and the "foreign aid" projects, in Figure 1. 9. Using the risk-adjusted discount rates found in Question 6, calculate the NPVs of Projects B (the seaport) and D (the mine). On the basis of these calculations, should Alaska Oil accept any of the projects? The NPVs for Projects A and C are negative-$13,669,000 and $4.619,000, respectively. 10. Evaluate Doug Cauldwell's argument that either Project B (the deepwater seaport) or Project C (the airport) should be accepted along with the oil protect 11. What other factors should Alaska Oil take into consideration before making a final decision? 12. Which project(s), if any, would you recommend to Alaska Oil's board of directors? Alaska Oil Corporation Capital Budgeting Directed David Fay, Alaska Oil's financial vice president, is preparing a report for the monthly directors' meeting. An important issue is on the agenda, a project which some of the directors have called "the foreign aid project." The government of Russia has agreed to give Alaska Oil Exploration, the oil drilling subsidiary of Alaska Oil, some important offshore oil concessions, provided Alaska Oil agrees to undertake at least one of the four investment projects listed in Table 1. Project A involves the development and construction of a power plant which, although it will not be completed and thus not produce any income for ten years, is expected to be worth approximately $594.45 million at the end of the tenth year. Project B, the construction of a deepwater seaport facility, has expected rev- enues of $22.945 million per year. Project C calls for the construction and operation of an airport facility from which revenues should increase as Russia's economic development progresses. Finally, Project D involves the development of a gold mining operation in central Siberia. D's revenues will be highest in the first year, but the ore body will be completely exhausted after four years. The projects' cash flows, standard deviations, and correlation coefficients as set forth in Table 1 were all developed by the World Bank, an organization supported by the United States and other industrialized nations to finance economic development in Third-World countries. The World Bank economists, who took the potential oil resources into consideration when they made their study, judged all four projects to be economically feasible. Although the projects admittedly carry a high degree of risk, the Bank is willing to finance any of them. However, the Bank's funds are sufficient to lend the Russian government the amounts necessary to complete only three of the four projects. Russia has therefore tied the granting of its oil concessions to Alaska Oil's taking on one or more of the listed projects. TABLE 1 Estimated Cash Flows for the "Foreign Aid Projects" Project Return in Year Project A: Power Plant (Cost = $75 Million) SO 0 0 0 0 0 0 0 0 594.45 1 2 3 4 5 6 7 Project B: Deepwater Seaport (Cost = ($75 Million) $22.945 22.945 22.945 22.945 22.945 22.945 22.945 22.945 22.945 22.945 Project C: Airport Facility (Cost - $75 Million) $19 20 21 22 23 25 27 29 31 33 Project D: Gold Mine (Cost = $75 Million) $51.3 34.7 17.0 9.9 0 0 9 10 0 Notes: 1. As estimated by the World Bank, the standard deviation (SD) of each cash flow listed above, including the project costs, is estimated to be 20 percent of the cash flow itself. For example, the SD of Project B's cash flows is $22.945 0.2 = $4.589 million, while the SDs of the costs are each $15 million. 2. Projects A's and D's cash flows are thought to be relatively uncorrelated with cash flows of B and D (r = 0.0). Also, D's cash flows are probably negatively correlated with cash flows on Alaska Oil's other assets (r = 0.8), but A's cash flows are probably positively correlated (r 0.8) because electricity prices will probably be high if oil prices are high. 3. The intertemporal cash flows on Projects B and C (i.e., CFt versus CFt+l) are thought to be relatively uncorrelated (r = 0.1), but D's intertemporal cash flows are thought to be highly correlated (r=0.9). 4. C's and D's cash flows are both fairly highly correlated with the oil project's cash flows (r = 0.5). As noted above, some of Alaska Oil's directors consider the four projects to amount to foreign aid. They think that the costs are probably underestimated and the projected cash flows overesti- mated, with the result being that Alaska Oil would lose heavily on any project it undertakes. How- ever, other directors are impressed with the research done by the World Bank's economists, whose report hinted that the projects' costs are very conservatively estimated and that revenues may well run double those shown in the table. Fay has tentatively concluded (1) that the projects all carry considerable risk, and (2) that no one of them is obviously better than any other. Some board members would prefer not to undertake any of the projects and therefore, not to accept the oil concessions. A majority of the board, how- ever, tentatively favor taking on one of the projects in order to obtain the concessions. Several board members have even suggested that all of the projects look interesting, and, given Alaska Oil's excess cash flows and unused debt capacity, will probably suggest that Alaska Oil take on more than one of the projects. A spokesman for this group recently sent Fay a memorandum indicating that, according to some rough estimates, each of the listed projects has a rate of return in excess of the 16 percent cutoff rate Alaska Oil uses in capital budgeting. He also pointed out that, due to the benefits of international diversification, the cutoff rate on international (as opposed to domestic U.S.) investments should be even less than 16 percent. The capital budgeting hurdle rate is almost sure to be brought up at the forthcoming direc- tors' meeting. Using 16 percent as the cutoff rate, or "hurdle rate," for all projects has been criticized by some directors on the grounds that less-risky projects should be evaluated at a lower cutoff rate, while higher-risk projects should have to pass a higher hurdle rate. Tom Dickerson, president of a major bank and a long-term member of Alaska Oil's board, advocates the use of different discount rates to account for differential project risk. He recently sent Fay the figures shown in Table 2. According to Dickerson, these figures support his contention that projects with differing degrees of risk should be capitalized at different rates of return. Fay believes that, while the four projects may not be equally risky, they are all about as risky as the riskiest industries on Dickerson's list. TABLE 2 Cost of Equity Estimates for Selected Domestic Industries Large public utilities Grocery chains Major chemical producers Large computer corporations International oil companies Smaller computer companies Small oil exploration companies Major industrial company stocks Small industrial company stocks Required Rate of Return on Equity 11% 12 14 15 16 21 26 23 Note: Estimates based on Justice Department Studies. The riskiness of international as opposed to domestic (U.S.) investments has also been ques- tioned. One group of directors has argued that international diversification lowers risk; hence, for- eign projects should be evaluated with a lower cost of capital. However, another group takes the opposite view, arguing that the combination of exchange rate risk and the risk of expropriation makes foreign investments far riskier. Fay himself thinks that the location of the investment is the key factor-investments in Western Europe may well be less risky because of the diversification fac- tor, but those in Russia are, in his view, quite another thing. Alaska Oil uses 40 percent debt in its capital structure, but it finances Alaska Oil Exploration only with equity because of the risks inherent in wildcat oil drilling. Fay believes that the exploration company's equity risk is similar to that of the parent company, because the parent's equity is lever- aged, but the exploration company's equity is not. Thus, 16 percent is the estimated cost of equity to the parent, but that same number is both the cost of equity and the WACC to the subsidiary. This rate is used to evaluate average-risk projects; higher or lower rates are used for more or less risky investments Another recommendation Fay must consider as he completes his report came in a telephone call from his boss, Doug Cauldwell, president of Alaska Oil. Cauldwell suggested that, assuming Alaska Oil does undertake one of the projects in order to obtain the oil concessions, the project should be either B, the deepwater seaport, or C, the airport installation. Cauldwell's argument is that these two projects tie-in quite well with the oil concession, because if the oil exploration project turns out to be successful, the economy of Russia will boom. In this event, both the seaport and the airport should be highly profitable. Thus, Alaska Oil's carnings would be improved substantially by a major strike in the oil drilling operations. Earnings would flow in from the oil itself, and the resultant economic boom would cause the seaport or airport investment to turn out even better than anticipated. These higher earnings would naturally be reflected in the price of Alaska Oil's common stock. Fay himself wonders how the standard deviation information and the correlations given in the notes to Table I should be taken into account, if at all. Alaska Oil has already spent and expensed for tax purposes) $25 million on geologic sur- veys for the offshore oil concessions. These expenditures include seismographic work and the drilling of one exploratory well. The seismographic data indicate a high probability of a sizable oil strike, and the one well that was drilled did produce a substantial flow of oil. Assuming that Alaska Oil goes ahead with the project, it must spend an additional $20 million on exploratory wells to determine the size of the oil field. This drilling will take about one year to complete, and the cash out- lay can be delayed until drilling is completed. Depending on the size of the field, the project may or may not be commercially feasible. The probability is 70 percent that the exploratory drilling will reveal that the field is commercially profitable. However, there is a 30 percent probability that additional drilling will indicate that the field cannot be developed commercially and, hence, that Alaska Oil should not go on with the project. Assuming the field can be developed, an additional S60 million must be spent to provide storage facilities, transportation facilities, and development wells. The $60 million will have to be paid out in advance, at the time the "go" decision is made and simultaneously with payment for the drilling costs. If Alaska Oil does undertake the oil exploration project, expected cash inflows. which would commence one year after the drilling and development costs had been incurred, are as follows: Probablility .10 20 40 20 .10 Net Cash Flow (Millions of Dollars) $10.00 17.50 27.50 42.50 60.00 Alaska Oil is not sure how long the annual flows would continue, but Fay's probability esti- mates are as follows: Alaska Oil is not sure how long the annual flows would continue, but Fay's probability esti- mates are as follows: Probablility 0.15 0.20 0.30 0.20 0.15 Life of the Offshore Oil Project (in Years). 5 10 20 30 35 Because of the obvious uncertainties in the offshore venture, Fay regards this project as being more risky than the average project taken on by the company. Also, the oil project's cash flows will be positively correlated with Alaska Oil's other cash flows (r=0.7). Alaska Oil must commit itself to a "foreign aid" project before it can go ahead with the addi- tional exploratory wells-it cannot wait until the results of the exploratory drilling are available before deciding on the "foreign aid" project. Therefore, if the company is to continue with the off- shore oil concession project, it must commit itself to at least one of the four projects at this time. Fay is concerned about a technical issue. Alaska Oil's financial staff has been debating the merits of the modified internal rate of return (MIRR) vis-a-vis the regular IRR and the period used to calculate MIRR. Fay regards the issue as pretty well settled that MIRR is generally superior to IRR, but he is concerned about what to do when two projects being compared have different lives, as is true for Project D versus the other projects. Should the calculated MIRR for the shorter-life pro- ject be based on its own life, or should the analysis be extended out to the end of the longer-life projects' lives? To illustrate the problem, Fay had been looking at a simple project with a cost of $10 and cash flows of $7 per year for two years, evaluated at a 10 percent cost of capital. The MIRR for the project is 21.24 percent based on its two-year life. However, if the project were being com- pared with a 10-year project, one could calculate the 2-year project's MIRR based on a 10 year time horizon; in this case, MIRR = 12.16%. Some of the staff argued for one procedure, while oth- ers argued for the alternative. The issue is relevant to the current decision, because Project D's life is shorter than those of the other projects. As he was starting to analyze the available information, Fay recalled an experience he had with another World Bank project last year-the Bank had provided a lot of information, but some of it was contradictory. This had forced Fay to decide which of the "facts" were correct. Fay wondered if that same situation might not exist in the present case, either with regard to World Bank data or to other data in the case. QUESTIONS 1. How should Alaska Oil use the information in Table 2 when deciding whether or not to select a project? 2. Calculate the expected internal rate of return and modified internal rate of return (MIRR) on the offshore oil project using both 16 percent and 26 percent as the appropriate cost of capi. tal for the project. Should the $25 million spent on geologic surveys be included in the anal- ysis? Assume for simplicity that all outlays are made immediately and that inflows begin one year from now. 3. Assuming Alaska Oil undertakes one of the four projects, calculate both the regular internal rates of return and the modified internal rates of return for Projects B and D. The regular IRRs are 23 and 27 percent for Projects A and C, respectively, and their MIRRs are 23 per- cent and 20.8 percent when compounded at 16 percent and, 23 percent and 26.4 percent when compounded at 26 percent. For these projects, are the regular or the modified IRRS more meaningful, or does it matter given that the projects are not mutually exclusive? Should D's MIRR be based on its own 4-year life or on the longer lives of the comparison projects? Based on your answers to this point, which foreign aid project, if any, should Alaska Oil accept? QUESTIONS 1. How should Alaska Oil use the information in Table 2 when deciding whether or not to select a project? 2. Calculate the expected internal rate of return and modified internal rate of return (MIRR) on the offshore oil project using both 16 percent and 26 percent as the appropriate cost of capi. tal for the project. Should the $25 million spent on geologic surveys be included in the anal- ysis? Assume for simplicity that all outlays are made immediately and that inflows begin one year from now. 3. Assuming Alaska Oil undertakes one of the four projects, calculate both the regular internal rates of return and the modified internal rates of return for Projects B and D. The regular IRRs are 23 and 27 percent for Projects A and C, respectively, and their MIRRs are 23 per- cent and 20.8 percent when compounded at 16 percent and, 23 percent and 26.4 percent when compounded at 26 percent. For these projects, are the regular or the modified IRRS more meaningful, or does it matter given that the projects are not mutually exclusive? Should D's MIRR be based on its own 4-year life or on the longer lives of the comparison projects? Based on your answers to this point, which foreign aid project, if any, should Alaska Oil accept? 4. How do (a) the timing patterns. (b) the correlations of the cash flows across projects, (c) the intertemporal correlations, and (d) the country in which the investments are located affect the relative riskiness of the projects? 5. Calculate the expected rate of return to Alaska Oil it it accepts either Project B or Project D. in combination with the oil drilling project. Undertaking Project A and the oil project yields a combined IRR of 26 25 percent, and for Project C plus the oil venture, this value is 30.21 percent. Based on these calculations, which project, if any, should Alaska Oil accept? 6. Fay thinks that while the data in Table 2 may be relevant for industries in the United States, the values do not adequately reflect the degree of risk inherent in international projects. Accordingly, he plans to use the capital asset pricing model (CAPM) to adjust for differen- tial risk: ti k KRE+ (km-koby = 8% + (15%-8%)b = 8% + (7%), Here. k risk-adjusted discount rate appropriate for th project KRE = risk-free rate of interest: Fay uses 8 percent based on U.S. Treasury bond yields. expected return on the market." Fay uses an historical figure of 15 percent. bi beta coefficient of the ith project: these values must be subjectively estimated, The World Bank analysis estimated the beta coefficients for each project as follows: ku Project A B D Oil Project Beta Coefficient 2.50 3.25 3.00 2.75 3.00 Alaska Oil's overall beta (with the market)is 1.143. Given this information, calculate the risk-adjusted discount rates for Alaska Oil, the oil exploration project, and Projects B and D. For Projects A and C, the values are 25.5 and 29 percent, respectively. Note that Alaska Oil's own beta was calculated without regard to the effects of any of these projects. 7. Alicia Fernandez, president of Friends of Russia (a UN-sponsored organization) and a direc- tor of Alaska Oil, has called Fay's attention to the hurdle rate of 16 percent (the cost of capi tal currently used for all projects). Since the IRRs of all five projects exceed 16 percent, she asks why, especially in view of Alaska Oil's ample cash flows and funds available for investment, all of the projects should not be accepted? Fay, like Dickerson, disagrees with this thinking, contending that none of the foreign aid projects gives Alaska Oil an ade quate return for the amount of risk the company would be taking. Fay plans to support his position by referring to Figure I, which shows that while all four projects' returns lie above the line representing the subsidiary's weighted average cost of capital they are below the The Security Market Line of the CAPM is used to estimate the required rate of return on equity. Since the cash flows developed in Table i represent only those flows that can be repatriated to the parent fim, all expenses, including interest costs on World Bank debt, have been deducted. Thus, the net cash flows are cash flows to equity holder and the appropriate hur dle rate is the cost of equity rather than the weighted average cost of capital Security Market Line (SML), which represents the minimum rate of return that a firm should require for a specified amount of risk. For example, Project A's beta coefficient is 2.50, so the minimum expected return that would make the project acceptable is 25.5 per- cent. Since the project's expected return is only 23 percent, the firm is not receiving ade- quate compensation for the amount of risk inherent in the investment, and, if accepted, the project would raise the firm's cost of capital. On the other hand, the oil project has a beta of 3.0, a required return of 29 percent, and an expected return of 33.77 percent. Since the expected return exceeds the risk-adjusted required rate of return (the project's own cost of equity), it apparently should be accepted. Of course, the oil project cannot be accepted unless one of the foreign aid" projects is accepted in conjunction with it. Therefore, calculate for Fay the weighted average beta coefficients for Projects B and D in conjunction with the oil drilling project. For Projects A and C. each combined with the oil project, the weighted beta coefficients are 2.73 and 3.00, respectively. Which combination of projects should be accepted? (Hint: plot these values, along with those found in Question 5, on Figure 1 to better illustrate the relative positions of the investment proposals.) Return 0.40 0.35 L1 1 Oil A 0.30 0.25 : 0.20 0.15 0.10 0.05 0.00 0.00 0.50 1.00 1.50 2.00 2.50 3.00 3.50 4.00 Figure 1 Risk Return Graph 8. Often, due to its ample operating cash flows, Alaska Oil has excess cash on hand over and above the amount required for daily operations. Fay invests these excesses in marketable securities rather than holding them as cash. Fay has thoroughly investigated one such poten- tial investment (not previously discussed in the case). Nockahoma Electronics Corporation, a Japanese company with a tight cash position due to its recent expansion program, requires a loan of $50 million. Nockahoma recently contacted Fay in hopes of borrowing the funds from Alaska Oil. After determining that his company has sufficient funds to meet the loan request, Fay esti- mated that this investment would have a beta coefficient of 0.5, while it would earn a return of 15 percent. He felt that the beta of 0.5 was appropriate for several reasons: (1) Fay has had a long history of successful dealings with Nockahoma: (2) Nockahoma is a very stable, profitable firm; (3) the loan can be called for repayment any time rates indicate a deteriorat- ing situation, and (4) the loan will be secured by some liquid, safe assets owned by Nocka- homa. In combination, these factors make the loan a very low-risk investment proposal. The problem Fay faces is that, although the Nockahoma proposal has a very small amount of risk and a return in excess of that required by the SML, the percentage return lies below the average cost of capital (or hurdle rate) of 16 percent that Alaska Oil Exploration presently employs. Fay sees this as an excellent opportunity to illustrate the desirability of using risk-adjusted discount rates rather than a constant discount rate for project selection Fay plans to point out that none of the individual "foreign aid" projects should be accepted, as their returns are not sufficient for the high degree of risk involved. Only when these individual projects are combined with the oil drilling project do some of them offer sufficient return to compensate for their risk. With the same argument, Fay contends that the Nockahoma loan should be accepted, as its return is in excess of the required rate of 11.5 percent read from the SML Should Alaska Oil make the $50 million loan to Nockahoma? Plot the loan, along with the oil project and the "foreign aid" projects, in Figure 1. 9. Using the risk-adjusted discount rates found in Question 6, calculate the NPVs of Projects B (the seaport) and D (the mine). On the basis of these calculations, should Alaska Oil accept any of the projects? The NPVs for Projects A and C are negative-$13,669,000 and $4.619,000, respectively. 10. Evaluate Doug Cauldwell's argument that either Project B (the deepwater seaport) or Project C (the airport) should be accepted along with the oil protect 11. What other factors should Alaska Oil take into consideration before making a final decision? 12. Which project(s), if any, would you recommend to Alaska Oil's board of directors