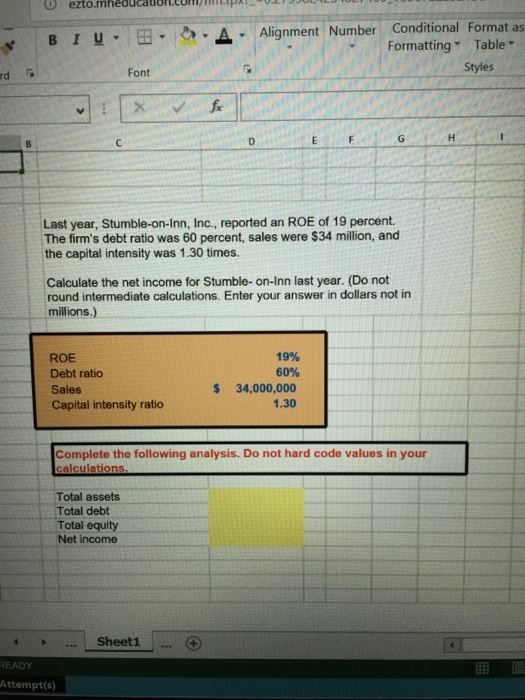
All answers must be entered as a formula please show work.

Please list all steps taken to solve quedt

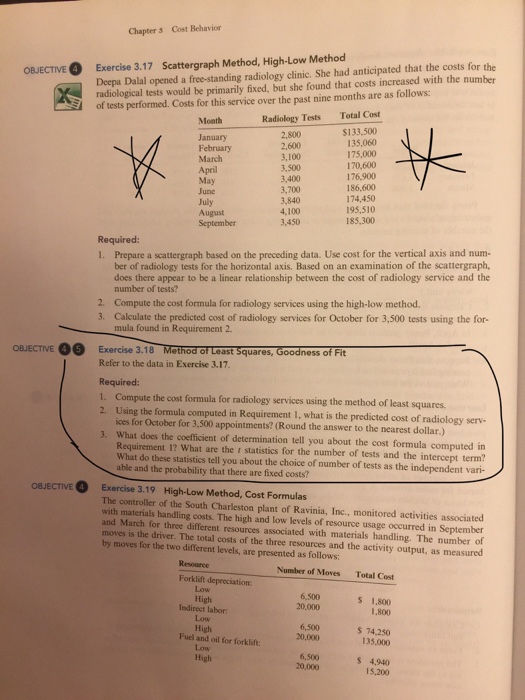
Cost Behavior Chapter s Deepa Dalal opened a free-standing radiology clinic. She had anticipated that the costs for the radiological tests would be primarily fixed, but she found that costs increased with the number OBJECTIVE Exercise 3.17 Scattergraph Method, High-Low Method of tests performed. Costs for this service over the past nine months are as follows: Radiology Tests 2,800 2,600 3,100 3,500 3,400 3,700 3,840 4,100 3,450 Total Cost $133,500 135,060 175,000 170,600 176,900 186,600 174,450 195,510 185,300 Month February March April 1. Prepare a scattergraph based on the preceding data. Use cost for the vertical axis and num- ber of radiology tests for the horizontal axis. Based on an examination of the scattergraph, does there appear to be a linear relationship between the cost of radiology service and the number of tests? Compute the cost formula for radiology services using the high-low method. Calculate the predicted cost of radiology services for October for 3,500 tests using the for- 2. 3. mula found in Requirement 2 06 Exercise 3.18 Mothod or Loeast Squares, Goodness of Fit Refer to the data in Exercise 3.17. equired: L. Compute the cost formula for radiology services using the method of least squares 2. Using the formula computed in Requirement 1, what is the predicted cost of radiology serv ices for October for 3,500 appointments? (Round the answer to the nearest dollar.) 3. What does the coefficient of determination tell you about the cost formula computed in Requirement 1? What are the t statistics for the number of tests and the intercept term? What do these statistics tell you about the choice of number of tests as the independent vari- able and the probability that there are fixed costs? OBJECTIVE 4 Exercise 3.19 The controller of the South Charleston plant of Ravinia, Inc., monitored activities associated High-Low Method, Cost Formulas with materials handling costs. The high and low levels of resource usage occurred in September and March for three different resources associated with materials handling. The number of moves is the driver. The total costs of the three resources and the activity output, as measured by moves for the two different levels, are presented as follows Number of Moves Total Cost Forklift depreciation 6,500 20,000 $ 1,800 1,800 Indirect labor High High 6,500 20,000 s74,250 135.000 Fuel and oil for forklift: 6,500 20,000 s 4,940 15,200


