Question
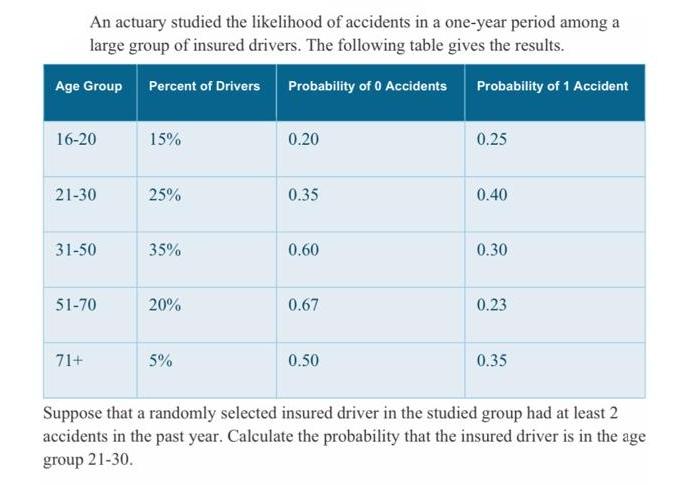
An actuary studied the likelihood of accidents in a one-year period among a large group of insured drivers. The following table gives the results.

An actuary studied the likelihood of accidents in a one-year period among a large group of insured drivers. The following table gives the results. Age Group Percent of Drivers Probability of 0 Accidents Probability of 1 Accident 16-20 21-30 31-50 51-70 71+ 15% 25% 35% 20% 5% 0.20 0.35 0.60 0.67 0.50 0.25 0.40 0.30 0.23 0.35 Suppose that a randomly selected insured driver in the studied group had at least 2 accidents in the past year. Calculate the probability that the insured driver is in the age group 21-30.
Step by Step Solution
There are 3 Steps involved in it
Step: 1
To calculate the probability that a randomly selected insured driver had at least 2 accidents in the ...
Get Instant Access to Expert-Tailored Solutions
See step-by-step solutions with expert insights and AI powered tools for academic success
Step: 2

Step: 3

Ace Your Homework with AI
Get the answers you need in no time with our AI-driven, step-by-step assistance
Get StartedRecommended Textbook for
Marketing Research
Authors: V. Kumar, Robert P. Leone, David A. Aaker, George S. Day
13th Edition
1119497639, 978-1119497639
Students also viewed these Accounting questions
Question
Answered: 1 week ago
Question
Answered: 1 week ago
Question
Answered: 1 week ago
Question
Answered: 1 week ago
Question
Answered: 1 week ago
Question
Answered: 1 week ago
Question
Answered: 1 week ago
Question
Answered: 1 week ago
Question
Answered: 1 week ago
Question
Answered: 1 week ago
Question
Answered: 1 week ago
Question
Answered: 1 week ago
Question
Answered: 1 week ago
Question
Answered: 1 week ago
Question
Answered: 1 week ago
Question
Answered: 1 week ago
Question
Answered: 1 week ago
Question
Answered: 1 week ago
Question
Answered: 1 week ago
Question
Answered: 1 week ago
Question
Answered: 1 week ago
Question
Answered: 1 week ago
View Answer in SolutionInn App


