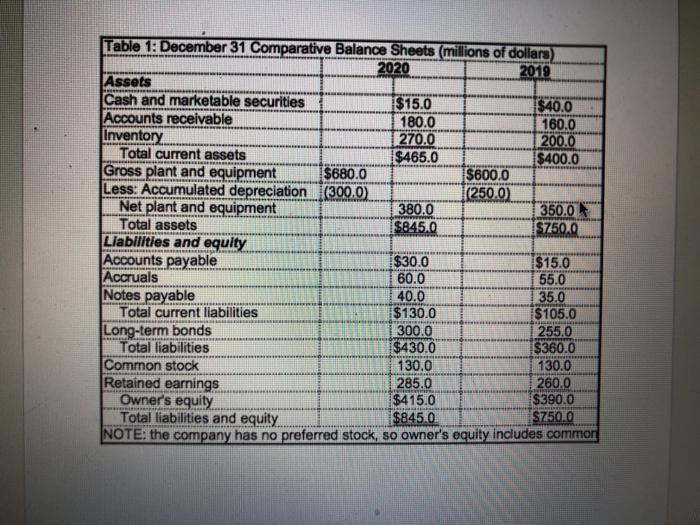
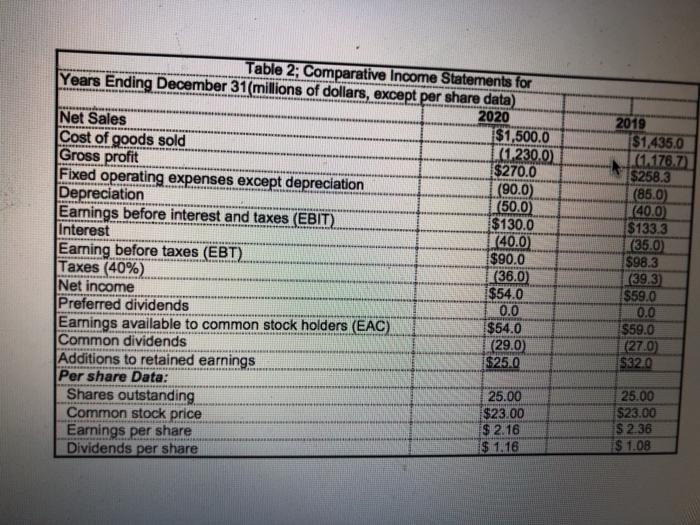
Analyzing the Financial Health of Company XYZ 1. How has the firm's liquidity changed from 2020 to 2019? a) Compute the current ratio & quick ratio and determine if the firm's liquidity has increased or decreased? b) What are some implications for this result? 2. How has the firm's long-term solvency changed from 2020 to 2019? a) Compute the debt ratio and determine if the firm has increased or decreased leverage? b) Compute the firm's times-interest earned & cash coverage ratio? c) Can the firm easily make its interest payments? 3. How has the firm's profitability changed from 2020 to 2019? Compute the following ratios i) profit margin ii) return on assets iii) return on equity 4. b) Has the firm improved its profitability? The stock is selling for $23 in the market as of 12/31/2020. Compute the PE ratio as of 12/31/2020. How would you interpret this number? S. Use Dupont analysis to calculate the firm's ROE in 2020 and 2019. Where are the significant changes that most impacted the change in the firm's ROE? 6. Calculate the Cash Flow from Assets, Cash Flow to Stockholders, and the Cash Flow to Bondholders in 2020. Table 1: December 31 Comparative Balance Sheets (millions of dollars) 2020 2019 Assets Cash and marketable securities $15.0 $40.0 Accounts receivable 180.0 160.0 Inventory 270.0 200.0 Total current assets $465.0 $400.0 Gross plant and equipment $680.0 $600.0 Less: Accumulated depreciation (300,0) (250.0 Net plant and equipment 380.0 350.0 Total assets $845.0 $750.0 Liabilities and equity Accounts payable $30.0 $15.0 Accruals 60.0 55.0 Notes payable 40.0 35.0 Total current liabilities $ 130.0 I$105.0 Long-term bonds 300.0 255.0 Total liabilities $430.0 $360.0 Common stock 130.0 130.0 Retained earnings 285.0 260.0 Owner's equity $415.0 $390.0 Total liabilities and equity $845.0 $750.0 NOTE: the company has no preferred stock, so owner's equity includes common Table 2; Comparative Income Statements for Years Ending December 31(millions of dollars, except per share data) 2020 Net Sales $1,500.0 Cost of goods sold (1.230.0 Gross profit $270.0 Fixed operating expenses except depreciation (90.0) Depreciation (50.0) Earnings before interest and taxes (EBIT) $130.0 Interest (40.0 Earning before taxes (EBT) $90.0 Taxes (40%) (36.0) Net income $54.0 Preferred dividends 0.0 Earnings available to common stock holders (EAC) $54.0 Common dividends (29.0) Additions to retained earnings $250 Per share Data: Shares outstanding 25.00 $23.00 Common stock price $ 2.16 Earnings per share $ 1.16 Dividends per share 2019 $1,435.0 - (1.176.7 $258.3 (850) (40.0 $133.3 (35.0 $98.3 (39.3) $59.0 0.0 $59.0 (270) 1532.0 25.00 $23.00 $ 236 $ 1.08


