Answer 1-20
need work shown for 15-20
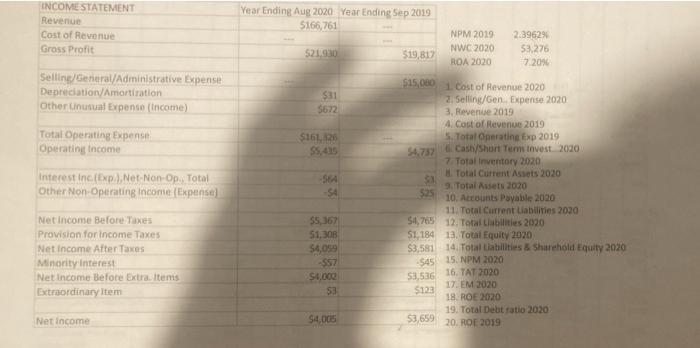
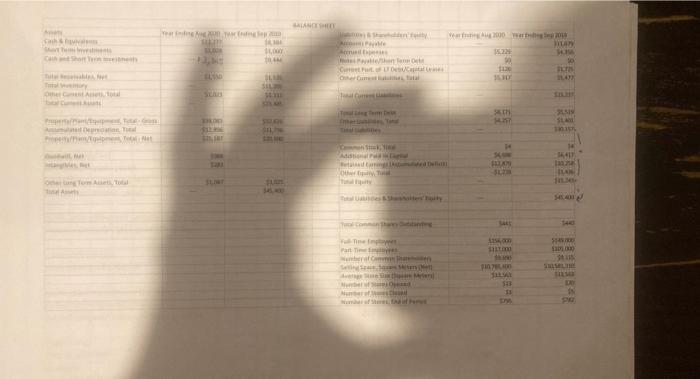
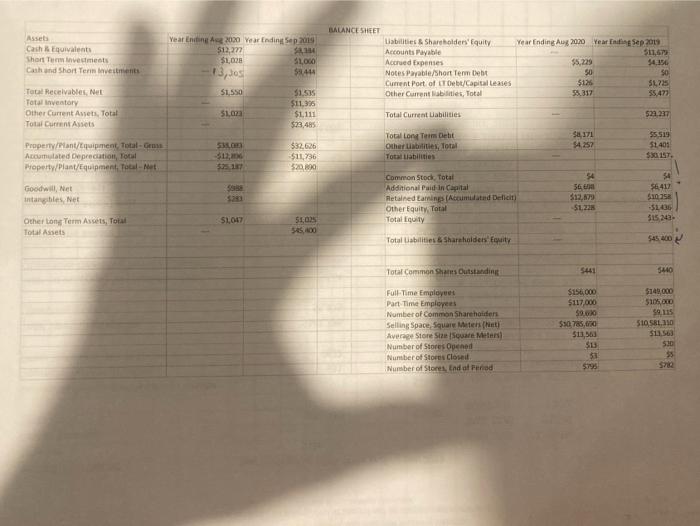
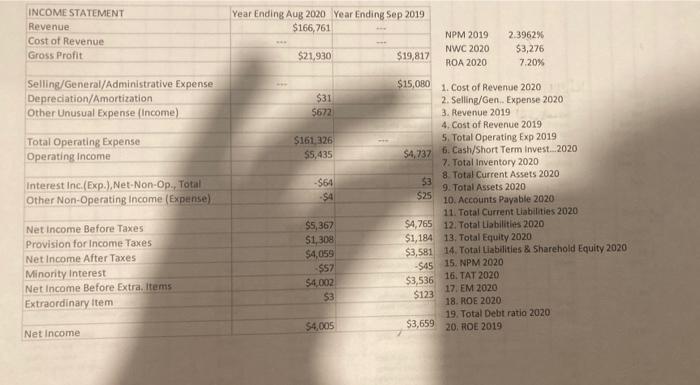
INCOME STATEMENT Revenue Cost of Revenue Gross Profit Selling/General/Administrative Expense Depreciation/Amortisation Other Unusual Expense (income) Total Operating Expense Operating Income Year Ending Aug 2020 Year Ending Sep 2019 5166,761 NPM 2019 2.3962 $21.930 NWC 2020 53.276 $19,81% ROA 2020 7.209 $15,000 1. Cost of Revenue 2020 $31 21 Selling/Gen. Expense 2020 5672 3. Revenue 2019 4. Cost of Revenue 2019 $161. 126 5. Total Operating Exp 2019 54.732 Cash/Short Term Invest 2020 7 Total Inventory 2020 SA Total Current Assets 2020 $1 9. Total Assets 2020 SA $25 10. Accounts Payable 2020 11. Total Current Liabilities 2020 $5,367 54,765 12. Total Liabilities 2020 51,308 $1 184 13. Total Equity 2020 $4,059 $3,581 14. Total Liabilities & Sharehold Equity 2020 $57 $45 15. NPM 2020 S4,000 SE53616. TAT 2020 $3 17. EM 2020 $123 18. ROE 2020 19. Total Debt ratio 2020 S4,005 $3,659 20. ROE 2019 Interest Inc (Exp:/Net.Non-Op. Total Other Non-Operating Income (Expense) Net Income Before Taxes Provision for income Taxes Net Income Atter Taxes Minority interest Net Income Before Extra Items Extraordinary Item Net Income MAAN W 2000 W 152 kesan to SIL th 19 st DE That 14 1541 Other SH DE Part ber Sem 15 Asset Cash Arquivalent Short Term investments Cash and Short Tervet Year Ending A 2020 Year Ending Sep 2019 $12, 14 $1,028 $1,000 13, Jos $2414 51,550 31.535 $11,35 31.07 $1.111 $23,485 BALANCE SHEET Liabilities & Shareholders Equity Accounts Payable Accrued Expenses Notes Payable/Short Term Debt Current Port of LTD/Capital leases Other Current libes, Total Year Ending Aug 2020 Year End Sep,2019 $11,67 $5,229 $4.154 50 SO $126 5L225 55.317 55,471 Total Receivables, et Total inventory Other Current Awets. Total Total Current Assets Total Current abilities 522 237 $a 371 $4257 Property/lant/equipment Total Accumulated Depreciation, Total Property/Plant Equipment. Total-Net 5.com $12, 5757 Total Long Term Debt Other Libilities, Total Total abilities $32.626 $11,736 320.00 $5.519 51401 5301ST Goodwill, Net intangibles.Net $8.50 5233 Common Stod, Total Additional Pain Capital Retained tamines (Acumulated Delicit Other Equity, Total Totality 54 56 con $12.79 51.225 $6412 $105 $1436 515243 $1,047 Other Long Term Assets, Total Total Assets 51,025 55100 Total abilities & Shareholders uity $45.400 Total Common Shan Outstanding 5441 5440 Full Time Employee Part Time Employees Number of Common Shareholders Selling Space Square Meter (int Average Store Stare Meters Number of Stores opened Number of Stores Close Number of Stores, End of Period $15,000 $117.000 59.00 $ 75,00 $13,500 313 53 $149,000 $105.000 58. 115 510 581, 110 $11.63 530 $ 5782 5195 INCOME STATEMENT Revenue Cost of Revenue Gross Profit Year Ending Aug 2020 Year Ending Sep 2019 $166,761 NPM 2019 NWC 2020 ROA 2020 2.3962% $3,276 7.20% $21.930 $19,817 Selling/General/Administrative Expense Depreciation/Amortization Other Unusual Expense (Income) $31 $672 Total Operating Expense Operating Income $161 326 $5,435 Interest Inc.(Exp.), Net-Non-Op. Total Other Non-Operating Income (Expense) -$64 $4 $15,080 1. Cost of Revenue 2020 2. Selling/Gen. Expense 2020 3. Revenue 2019 4. Cost of Revenue 2019 5. Total Operating Exp 2019 $4,737 6. Cash/Short Term Invest...2020 7. Total Inventory 2020 53 8 Total Current Assets 2020 9. Total Assets 2020 $25 10. Accounts Payable 2020 11. Total Current Liabilities 2020 $4,765 12. Total Liabilities 2020 $1,184 13. Total Equity 2020 $3,581 14. Total Liabilities & Sharehold Equity 2020 -S45 15. NPM 2020 $3,536 16. TAT 2020 17. EM 2020 18. ROE 2020 19. Total Debt ratio 2020 $3,659 20. ROE 2019 Net Income Before Taxes Provision for Income Taxes Net Income After Taxes Minority interest Net Income Before Extra. Items Extraordinary Item $5,367 $1,308 $4,059 $57 $4,002 $3 $123 $4,005 Net Income INCOME STATEMENT Revenue Cost of Revenue Gross Profit Selling/General/Administrative Expense Depreciation/Amortisation Other Unusual Expense (income) Total Operating Expense Operating Income Year Ending Aug 2020 Year Ending Sep 2019 5166,761 NPM 2019 2.3962 $21.930 NWC 2020 53.276 $19,81% ROA 2020 7.209 $15,000 1. Cost of Revenue 2020 $31 21 Selling/Gen. Expense 2020 5672 3. Revenue 2019 4. Cost of Revenue 2019 $161. 126 5. Total Operating Exp 2019 54.732 Cash/Short Term Invest 2020 7 Total Inventory 2020 SA Total Current Assets 2020 $1 9. Total Assets 2020 SA $25 10. Accounts Payable 2020 11. Total Current Liabilities 2020 $5,367 54,765 12. Total Liabilities 2020 51,308 $1 184 13. Total Equity 2020 $4,059 $3,581 14. Total Liabilities & Sharehold Equity 2020 $57 $45 15. NPM 2020 S4,000 SE53616. TAT 2020 $3 17. EM 2020 $123 18. ROE 2020 19. Total Debt ratio 2020 S4,005 $3,659 20. ROE 2019 Interest Inc (Exp:/Net.Non-Op. Total Other Non-Operating Income (Expense) Net Income Before Taxes Provision for income Taxes Net Income Atter Taxes Minority interest Net Income Before Extra Items Extraordinary Item Net Income MAAN W 2000 W 152 kesan to SIL th 19 st DE That 14 1541 Other SH DE Part ber Sem 15 Asset Cash Arquivalent Short Term investments Cash and Short Tervet Year Ending A 2020 Year Ending Sep 2019 $12, 14 $1,028 $1,000 13, Jos $2414 51,550 31.535 $11,35 31.07 $1.111 $23,485 BALANCE SHEET Liabilities & Shareholders Equity Accounts Payable Accrued Expenses Notes Payable/Short Term Debt Current Port of LTD/Capital leases Other Current libes, Total Year Ending Aug 2020 Year End Sep,2019 $11,67 $5,229 $4.154 50 SO $126 5L225 55.317 55,471 Total Receivables, et Total inventory Other Current Awets. Total Total Current Assets Total Current abilities 522 237 $a 371 $4257 Property/lant/equipment Total Accumulated Depreciation, Total Property/Plant Equipment. Total-Net 5.com $12, 5757 Total Long Term Debt Other Libilities, Total Total abilities $32.626 $11,736 320.00 $5.519 51401 5301ST Goodwill, Net intangibles.Net $8.50 5233 Common Stod, Total Additional Pain Capital Retained tamines (Acumulated Delicit Other Equity, Total Totality 54 56 con $12.79 51.225 $6412 $105 $1436 515243 $1,047 Other Long Term Assets, Total Total Assets 51,025 55100 Total abilities & Shareholders uity $45.400 Total Common Shan Outstanding 5441 5440 Full Time Employee Part Time Employees Number of Common Shareholders Selling Space Square Meter (int Average Store Stare Meters Number of Stores opened Number of Stores Close Number of Stores, End of Period $15,000 $117.000 59.00 $ 75,00 $13,500 313 53 $149,000 $105.000 58. 115 510 581, 110 $11.63 530 $ 5782 5195 INCOME STATEMENT Revenue Cost of Revenue Gross Profit Year Ending Aug 2020 Year Ending Sep 2019 $166,761 NPM 2019 NWC 2020 ROA 2020 2.3962% $3,276 7.20% $21.930 $19,817 Selling/General/Administrative Expense Depreciation/Amortization Other Unusual Expense (Income) $31 $672 Total Operating Expense Operating Income $161 326 $5,435 Interest Inc.(Exp.), Net-Non-Op. Total Other Non-Operating Income (Expense) -$64 $4 $15,080 1. Cost of Revenue 2020 2. Selling/Gen. Expense 2020 3. Revenue 2019 4. Cost of Revenue 2019 5. Total Operating Exp 2019 $4,737 6. Cash/Short Term Invest...2020 7. Total Inventory 2020 53 8 Total Current Assets 2020 9. Total Assets 2020 $25 10. Accounts Payable 2020 11. Total Current Liabilities 2020 $4,765 12. Total Liabilities 2020 $1,184 13. Total Equity 2020 $3,581 14. Total Liabilities & Sharehold Equity 2020 -S45 15. NPM 2020 $3,536 16. TAT 2020 17. EM 2020 18. ROE 2020 19. Total Debt ratio 2020 $3,659 20. ROE 2019 Net Income Before Taxes Provision for Income Taxes Net Income After Taxes Minority interest Net Income Before Extra. Items Extraordinary Item $5,367 $1,308 $4,059 $57 $4,002 $3 $123 $4,005 Net Income