Answered step by step
Verified Expert Solution
Question
1 Approved Answer
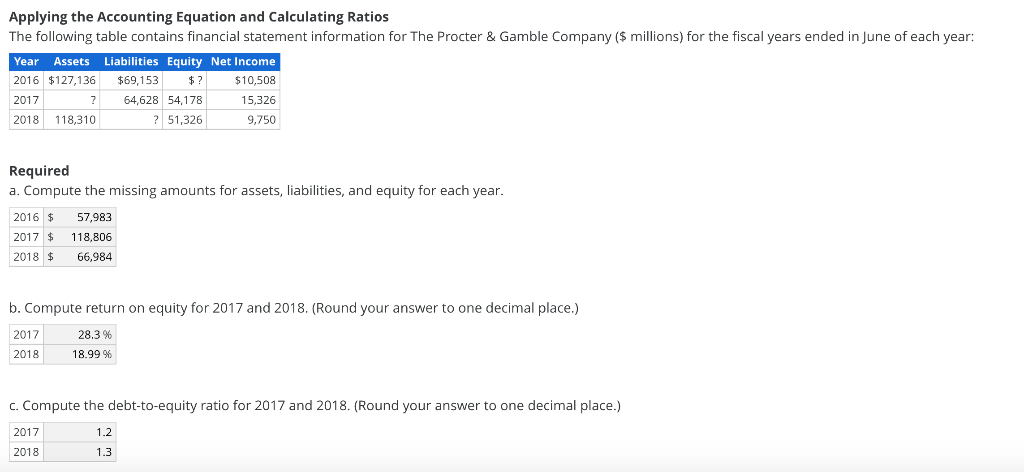
answer (b) is wrong Applying the Accounting Equation and Calculating Ratios The following table contains financial statement information for The Procter & Gamble Company ($

answer (b) is wrong
Applying the Accounting Equation and Calculating Ratios The following table contains financial statement information for The Procter & Gamble Company ($ millions) for the fiscal years ended in June of each year: Year Assets Liabilities Equity Net Income 2016 $127,136 $69,153 $? 2017 ? 64,628 54,178 15,326 2018 118,310 ? 51,326 9,750 $10,508 Required a. Compute the missing amounts for assets, liabilities, and equity for each year. 2016 $ 57,983 2017 $ 118,806 2018 $ 66,984 b. Compute return on equity for 2017 and 2018. (Round your answer to one decimal place.) 2017 28.3% 2018 18.99 % c. Compute the debt-to-equity ratio for 2017 and 2018. (Round your answer to one decimal place.) 2017 1.2 2018 1.3Step by Step Solution
There are 3 Steps involved in it
Step: 1

Get Instant Access to Expert-Tailored Solutions
See step-by-step solutions with expert insights and AI powered tools for academic success
Step: 2

Step: 3

Ace Your Homework with AI
Get the answers you need in no time with our AI-driven, step-by-step assistance
Get Started


