

Answered step by step
Verified Expert Solution
Question
1 Approved Answer
answer questions 4-6 Which of the following are useful for analyzing data over time for many different companies7 Select all that apply Phease add checkrrark
answer questions 4-6 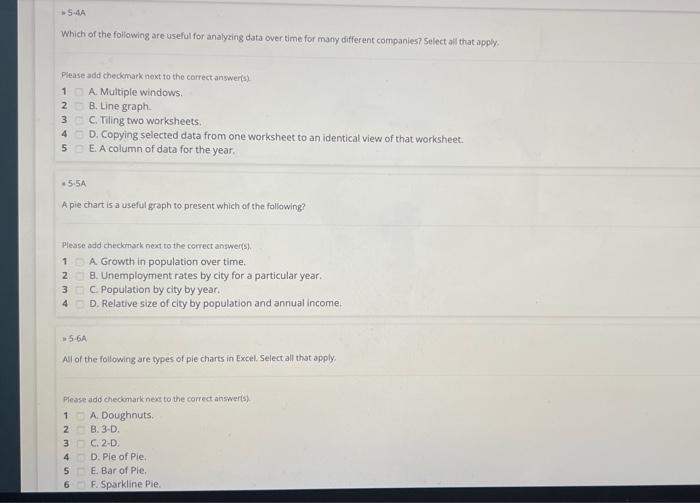 Which of the following are useful for analyzing data over time for many different companies7 Select all that apply Phease add checkrrark next to the correct answer(s) 1 A. Multiple windows. 2. B, Line graph. 3 C. Tiling two worksheets. 4 D. Copying selected data from one worksheet to an identical view of that worksheet. 5 E. A column of data for the year. .5.5A A pie chart is a useful graph to present which of the fallowing? Please add checkmark next to the correct answer(s). 1 A. Growth in population over time. 2. Unemployment rates by city for a particular year. 3 C. Population by city by year. 4 D. Relative size of city by population and annuat income. 156A Al of the following are types of ple charts in Excel. Select all that apply: Please add checkmark nexs to the correct answeris) 1 A. Doughnuts. 2 B. 3-D. 3 C. 2-D. 4 D. Ple of Ple. 5 E. Bar of Pie. 6. F. Sparkline Pie
answer questions 4-6
Step by Step Solution
There are 3 Steps involved in it
Step: 1

Get Instant Access to Expert-Tailored Solutions
See step-by-step solutions with expert insights and AI powered tools for academic success
Step: 2

Step: 3
Ace Your Homework with AI
Get the answers you need in no time with our AI-driven, step-by-step assistance
Get Started
Audit Marketing
Authors: Bruno Camus
1st Edition
2708108735, 978-2708108738