

Answered step by step
Verified Expert Solution
Question
1 Approved Answer
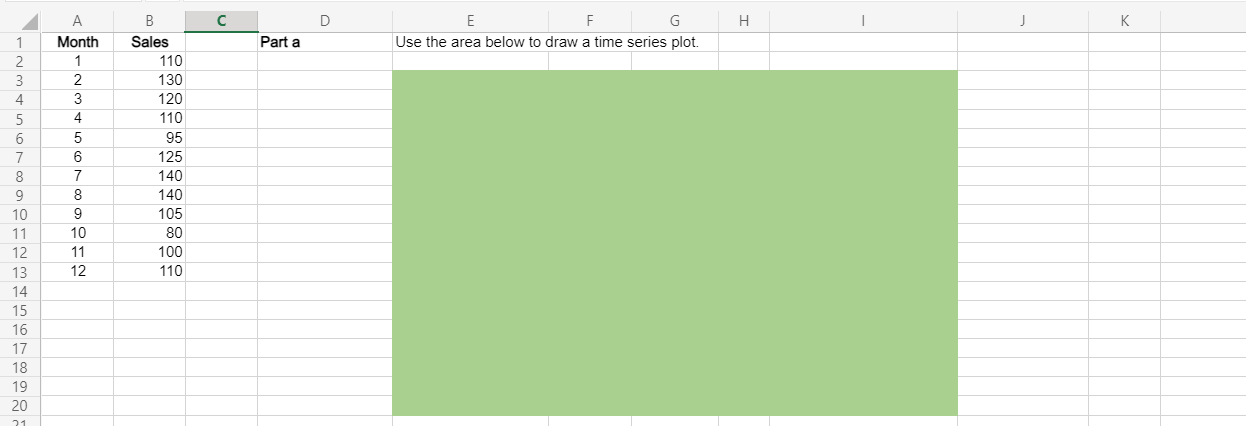
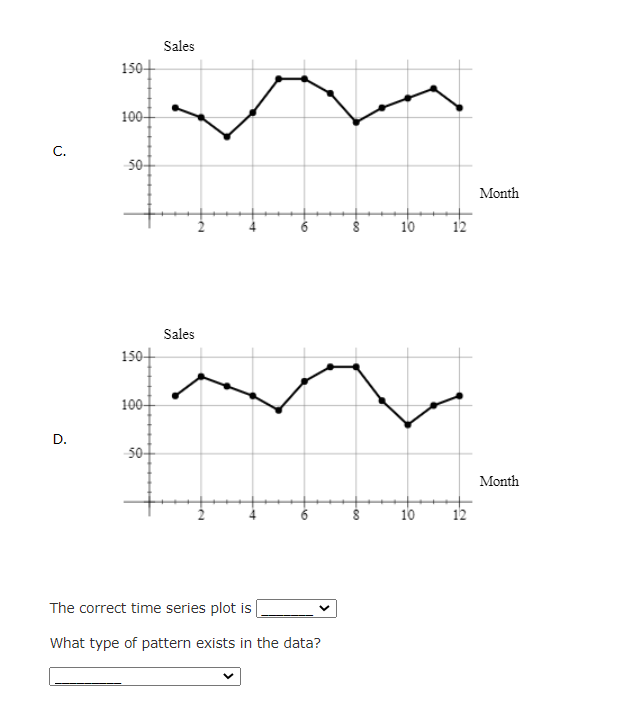
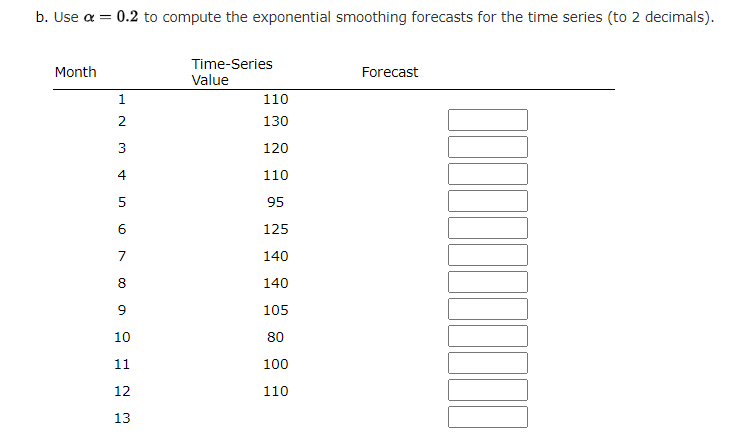
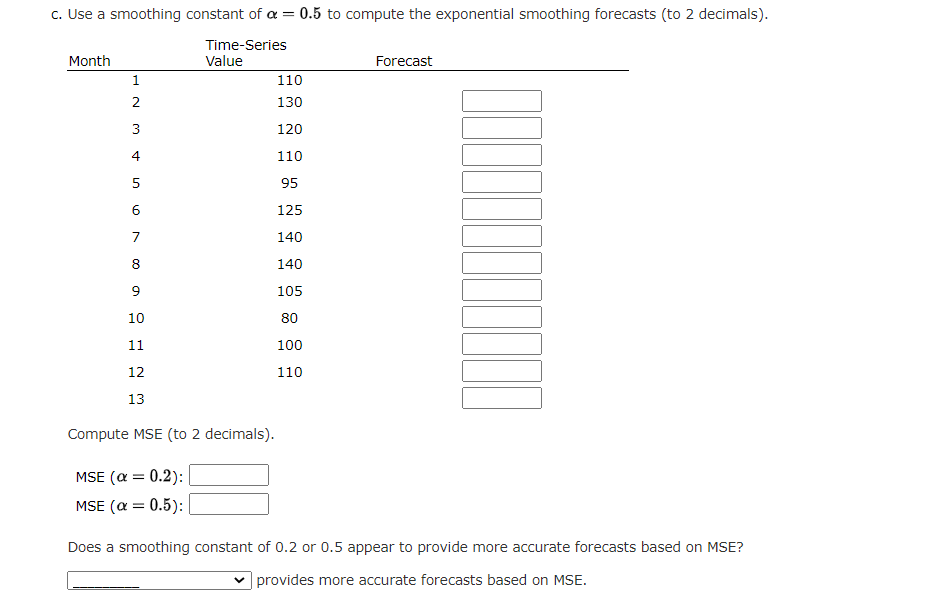
Answers from our experts for your tough homework questions B H Month 1 Parta Use the area below to draw a time series plot. NONOOM
Answers from our experts for your tough homework questions
Step by Step Solution
There are 3 Steps involved in it
Step: 1

Get Instant Access to Expert-Tailored Solutions
See step-by-step solutions with expert insights and AI powered tools for academic success
Step: 2

Step: 3
Ace Your Homework with AI
Get the answers you need in no time with our AI-driven, step-by-step assistance
Get Started
International Finance
Authors: Maurice D. Levi
4th Edition