

Answered step by step
Verified Expert Solution
Question
1 Approved Answer
Assignment - 1 - Building a weather app The app should have a responsive user interface that works well on both desktop and mobile devices.
Assignment Building a weather app
The app should have a responsive user interface that works well on both desktop and mobile devices.
Users should be able to search for a city by name and see the current temperature, weather conditions, and wind speed for that location.
Users should be able to switch between Celsius and Fahrenheit units of measurement.
The app should use a public weather API such as QpenWeatherMap to retrieve the current weather data.
The app should display appropriate error messages if the API returns an error or the user's search query does not match any known locations.
The app should include a "recent searches" feature that displays a list of the last five cities that the user has searched for.
The candidate should use appropriate error handling and validation to ensure that the application is robust and userfriendly.
Navigation and header bar should be same across page.
Some chart should render to show past weather data.
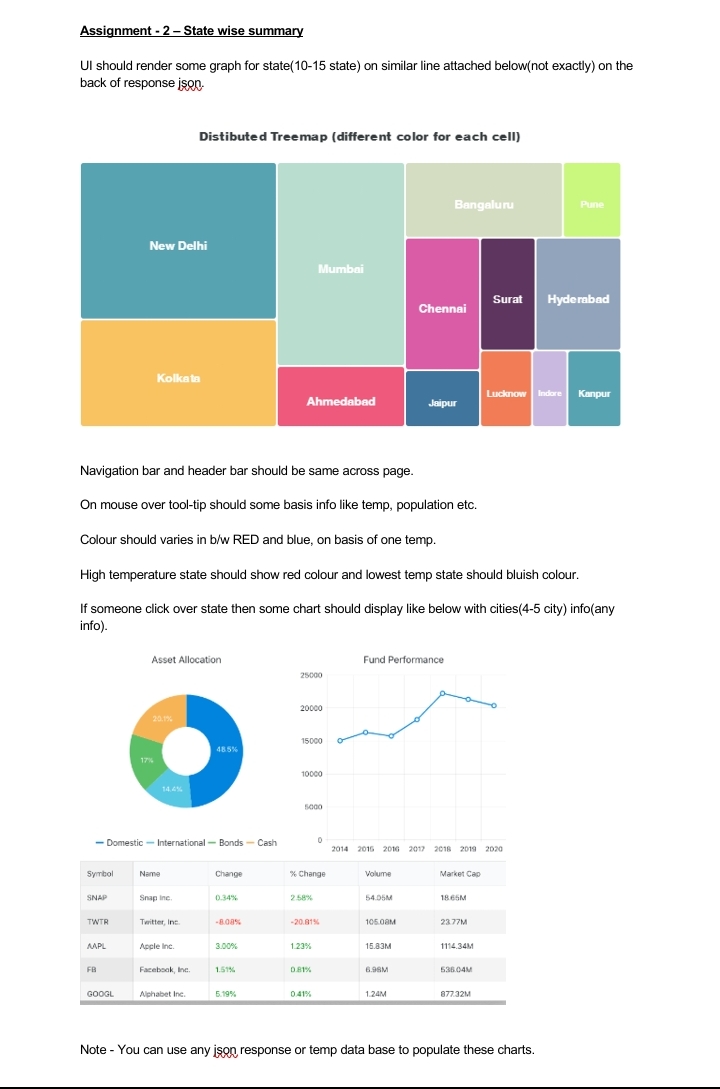
Assignment State wise summary
UI should render some graph for state state on similar line attached belownot exactly on the back of response json.
Distibuted Treemap different color for each cell
Navigation bar and header bar should be same across page.
On mouse over tooltip should some basis info like temp, population etc.
Colour should varies in bw RED and blue, on basis of one temp.
High temperature state should show red colour and lowest temp state should bluish colour.
If someone click over state then some chart should display like below with cities city infoany info
Asset Allocation
Note You can use any ison response or temp data base to populate these charts.
Step by Step Solution
There are 3 Steps involved in it
Step: 1

Get Instant Access to Expert-Tailored Solutions
See step-by-step solutions with expert insights and AI powered tools for academic success
Step: 2

Step: 3
Ace Your Homework with AI
Get the answers you need in no time with our AI-driven, step-by-step assistance
Get Started
Logics For Databases And Information Systems
Authors: Jan Chomicki ,Gunter Saake
1st Edition
1461375827, 978-1461375821