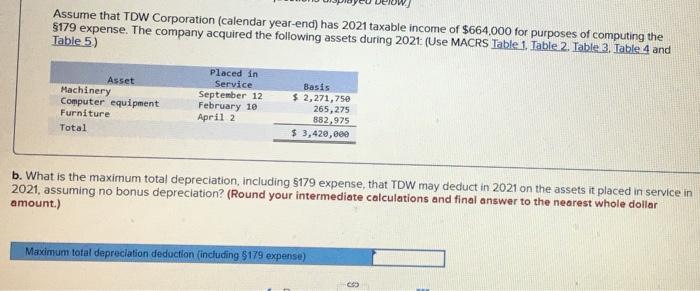
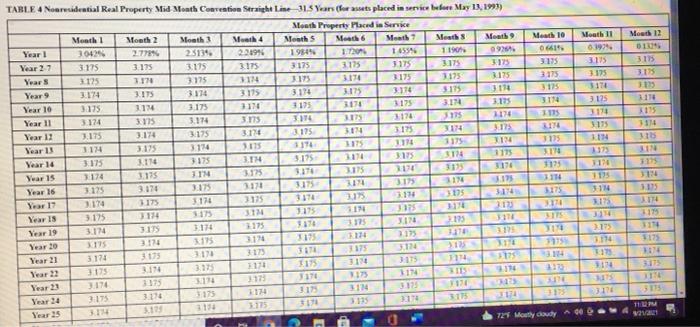
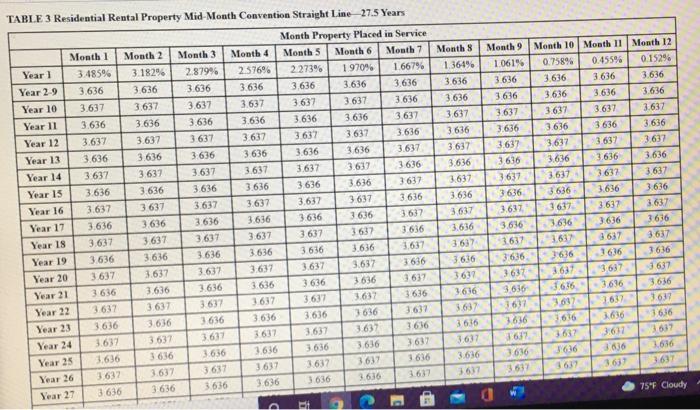
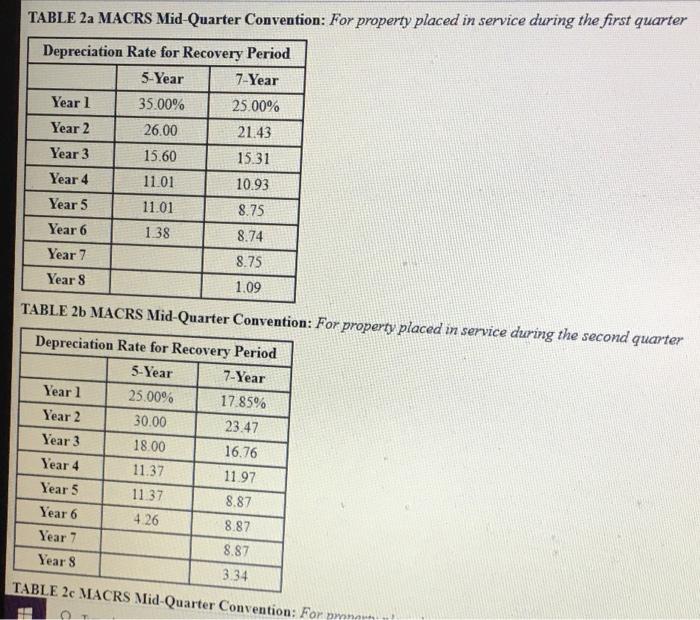
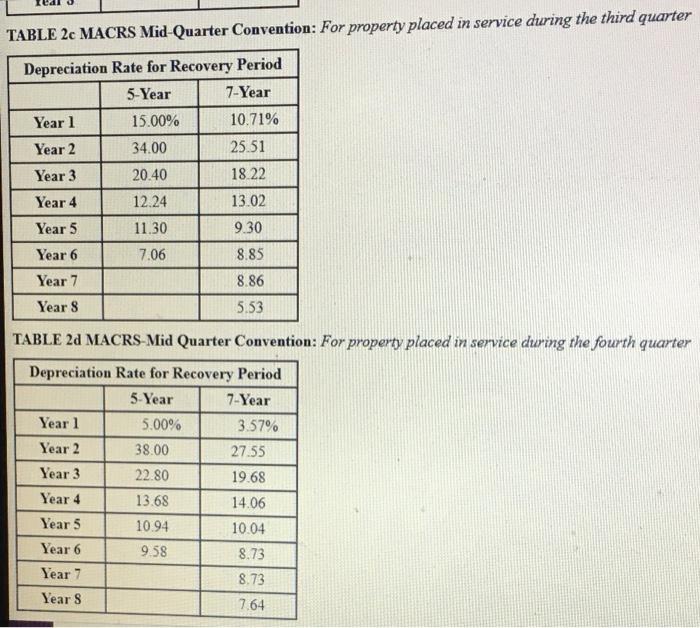
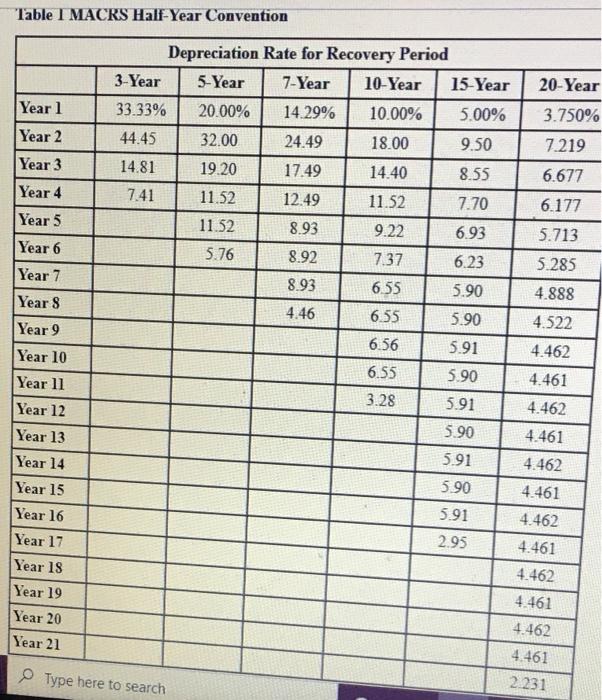
Assume that TDW Corporation (calendar year-end) has 2021 taxable income of $664,000 for purposes of computing the $179 expense. The company acquired the following assets during 2021: (Use MACRS Table 1. Table 2. Table 3. Table 4 and Table 5) Placed in Asset Service Basis Machinery September 12 $ 2,271,750 Computer equipment February 10 265,275 Furniture April 2 882,975 Total $ 3,420,000 b. What is the maximum total depreciation, including 5179 expense, that TDW may deduct in 2021 on the assets it placed in service in 2021, assuming no bonus depreciation? (Round your intermediate calculations and final answer to the nearest whole dollar amount.) Maximum total depreciation deduction (including S179 expense) S TABLE 5 Nonresidential Real Property Mid Moth Creative Straight Lie 19 Years for sus placed in services or after May 13, 1993) Meath Property Maced in Service Month 1 Moth Moot Moth 4 Mooth Month Month 7 Monik Meath Year! 2.4615 22475 2033 1.8195 1605 13919 1177 0939 0.7499 Year 2-39 2.566 2.566 2.568 2564 Year 40 0.107 0321 0.535 0.749 0.963 1177 1391 1505 1819 Month 10 05359 3563 2033 Month 11 0.014 2554 M12 0107 2464 2:41 Mouth 12 O. 3115 3.15 315 1114 31 10 311 111 CLET DIE 3175 TABLE 4 Nonresidential Real Property Mid Month Convention Straight line 315 Years for sus placed in service before May 13, 1993) Month Property Placedia Service Month 1 Month 2 Month 3 Muk 4 Months Much 6 Meath Meth Meth Meath 10 Mouth 11 Year! 30425 2779 25139 2019 19849 120 165546 1190 09264 06619 1939 Year 27 3175 3.175 3115 3.175 3 175 3175 3175 3.175 3:17 3175 3175 Years 3125 3175 1114 1175 3.17 3175 1175 3.175 3175 3175 Year 3.174 3.175 3114 3175 3.174 3.175 3:114 5115 3114 3115 1174 Year 10 3175 1114 3.173 3114 3175 3171 3175 3174 3.115 3 125 Year 11 3174 5175 3.174 3.715 14 3115 3174 3115 21 1115 3174 Year 17 3.175 3.174 3:175 3175 3175 3114 9123 3175 Year 13 1174 3.175 3.174 3115 314 1115 1114 1115 14 3115 Year 14 3.175 3110 3.114 3175 2014 3.15 3174 1175 311 Year 15 3174 1.115 31 SIT 3115 11 Year 16 3.175 3.175 3170 3175 317 315 31N 3175 3.174 3175 5174 3135 3116 3110 3075 3.114 3:114 3.195 Year is 1114 314 315 3116 3.875 3.1 3.13 Year 19 3.174 315 1174 1125 519 Year 20 319 175 315 119 15 31 1114 31 15 Year 21 3.114 3174 1173 3175 3174 3.10 31 314 3115 194 117 175 3.11 Year 22 23 21 Year 23 314 3173 3.174 11 11 Year 24 5.173 3.174 1174 311 118 3114 1175 Vear 25 725 Mostyudy - 3175 3.07 CETE NIE IN 114 3179 311 117 INT DIE 3114 14 TE SEE S11 BE SIE 2179 PIE SETE TE PIT SLEE LE PIE SIE TE SIE 3175 1 1 110 PM 25 Coudy 60 960 0197 011 0911 AE ST TE 1990 21 HT HE TO 315 114 OLI VE SLEC SERE 11 JI 11 3174 TIE SEE SCHE VEC 5174 3:17 3.175 WEL PLIE SLIE NE SITE LE SIE Vear Year 32 Year 1 Year 30 Year 29 Year 28 Year 27 Year 26 NIE SIE PIE SLEE VE SLI TIE SLI PIE SLIE TIE SLIE NE SZE SET PRE RE E TIE 3.174 3.175 3174 SEE RE CUTE 3.175 HIE SLEE TIE TIE PE SEE 3170 3.175 3:174 3.175 3174 3.174 3.175 SLIE Month 9 1 061% 3636 3.636 3.637 TABLE 3 Residential Rental Property Mid-Month Convention Straight Line 27.5 Years Month Property Placed in Service Month 1 Month 2 Month 3 Month 4 Month 5 Month 6 Month 7 Year 1 3.485% 3.182% 2.879% 2.576% 2 273% 1970% 1.667% Year 29 3.636 3.636 3.636 3.636 3636 3.636 3.636 Year 10 3.637 3.637 3.637 3.637 3632 3.637 3.636 Year 11 3.636 3.636 3.636 3.636 3.636 3.636 3.637 Year 12 3.637 3.637 3637 3 637 3637 3637 3.636 Year 13 3.636 3.636 3.636 3636 3.636 3.636 3.637 Year 14 3637 3637 3.637 3.637 3,637 3.637 3.636 Year 15 3.636 3.636 3.636 3.636 3636 3.636 3 637 Year 16 3.637 3 637 3.637 3637 3.632 3.637 3.636 Year 17 3.636 3636 3636 3636 3.636 3636 3.632 Year 18 3.637 3637 3.637 3.637 3637 3637 3.636 Year 19 3.636 3.636 3.636 3.636 3.636 3636 1.637 Year 20 3637 3.637 3.637 3.637 3.637 3.637 Year 21 3.636 3.636 3.636 3.636 3.636 3636 3637 3637 Year 22 3.637 3.637 3637 3.637 3637 3636 3636 3.636 3636 Year 23 3637 3636 3.636 3636 3.637 3.637 3637 Year 24 1616 3637 3.637 3.637 3636 Year 25 3636 3.636 3.636 3.636 3.636 1636 3.637 3632 Year 26 3637 3637 3637 3637 1637 3.636 3.636 Year 27 3636 3636 3636 3.636 Month 8 1.364% 3.636 3.636 3637 3 636 3.637 3.636 3.637 3.636 3.637 3.636 3.637 3636 3636 3.637 3.636 3637 3.636 3637 3636 3.637 3.636 1637 3.636 3637 9.636 16) 3636 3617 3.636 3637 Month 10 Month II Month 12 0.758% 0.455% 0.15296 3.636 3.636 3.636 3636 3.636 3637 3.637 3.636 3.636 3.636 3.637 3.637 3.637 3636 3636 3.636 3.637 3637 3.637 3636 3.636 3.636 1 637 3.637 3.637 3.636 3.636 3636 3637 8637 3.637 3636 1636 3636 3637 3637 3637 1636 3.636 3.636 3697 3632 3637 3.636 1636 3637 3.632 2637 1636 3836 1636 3637 3637 3.63 3616 3.636 3637 3636 3637 3.636 3637 3.632 75F Cloudy 3637 3637 3.636 3637 3.636 1.97 Year 25 Year 26 Year 27 Year 28 Year 29 3.636 3.637 3.636 2273 3.636 3.637 3.636 2.576 3636 3.637 3636 2879 3.636 3.637 3.636 3.182 3.636 3637 3.636 1485 3.636 3.637 3.637 3636 3.637 3.636 0.455 3.637 3636 3.637 3636 0.758 3.63 3.636 3.637 3.636 1061 3.637 3.636 3637 3.636 1564 3.636 3.637 U 3636 3636 0 152 1667 12V TABLE 2a MACRS Mid Quarter Convention: For property placed in service during the first quarter Depreciation Rate for Recovery Period 5-Year 7-Year Year 1 35.00% 25.00% Year 2 26.00 21.43 Year 3 15.60 15.31 Year 4 11.01 10.93 Year 5 11.01 8.75 Year 6 1.38 8.74 Year 7 8.75 Year 8 1.09 TABLE 26 MACRS Mid-Quarter Convention: For property placed in service during the second quarter Depreciation Rate for Recovery Period 5-Year 7-Year Yearl 25.00% 17.85% Year 2 30.00 23.47 Year 3 18.00 16.76 Year 4 11.37 11.97 Year 5 11.37 8.87 Year 6 8.87 Year 7 8.87 Years 3.34 426 TABLE 2c MACRS Mid-Quarter Convention: For pronar TABLE 2c MACRS Mid Quarter Convention: For property placed in service during the third quarter Depreciation Rate for Recovery Period 5-Year 7-Year Year 1 15.00% 10.71% Year 2 34.00 25.51 Year 3 20.40 18.22 Year 4 12.24 13.02 Year 5 11.30 9.30 Year 6 7.06 8.85 Year 7 8.86 Year 8 5.53 TABLE 20 MACRS-Mid Quarter Convention: For property placed in service during the fourth quarter Depreciation Rate for Recovery Period 5-Year 7-Year Year 1 5.00% 3.57% Year 2 38.00 27.55 Year 3 22.80 19.68 Year 4 13.68 14.06 Year 5 10.94 10.04 Year 6 9.58 8.73 Year 7 8.73 Years 7.64 Table I MACRS Half-Year Convention 20-Year Year 1 3.750% 7.219 Year 2 Year 3 Year 4 6.677 6.177 Year 5 Year 6 Depreciation Rate for Recovery Period 3-Year 5-Year 7-Year 10-Year 15-Year 33.33% 20.00% 14.29% 10.00% 5.00% 44.45 32.00 24.49 18.00 9.50 14.81 19.20 17.49 14.40 8.55 7.41 11.52 12.49 11.52 7.70 11.52 8.93 9.22 6.93 5.76 8.92 7.37 6.23 8.93 6.55 5.90 4.46 6.55 5.90 6.56 5.91 6.55 5.90 3.28 5.91 5.90 5.91 590 5.713 5.285 4.888 4.522 4.462 4.461 4.462 4.461 Year 7 Year 8 Year 9 Year 10 Year 11 Year 12 Year 13 Year 14 Year 15 Year 16 Year 17 Year 18 Year 19 Year 20 Year 21 5.91 2.95 4.462 4.461 4.462 4.461 4.462 4.461 4.462 4.461 Type here to search 2.231
