

Question
At what annual rate has NET SALES grown since 2015? __________________ At the above growth rate, what would you expect NET SALES to be in
At what annual rate has NET SALES grown since 2015? __________________ At the above growth rate, what would you expect NET SALES to be in 2027? __________________ At the above growth rate, what would NET SALES have BEEN in 2009? __________________ At the above growth rate, how long will it take TOTAL ASSETS to DOUBLE?
For all final answer please have it in the following format
ACTUAL DOLLAR $123456.78 PERCENT 1234.5678%
DECIMAL 12.345678 OTHER 12.345678
(as shown in the calculator display) Example: years, employees, etc.
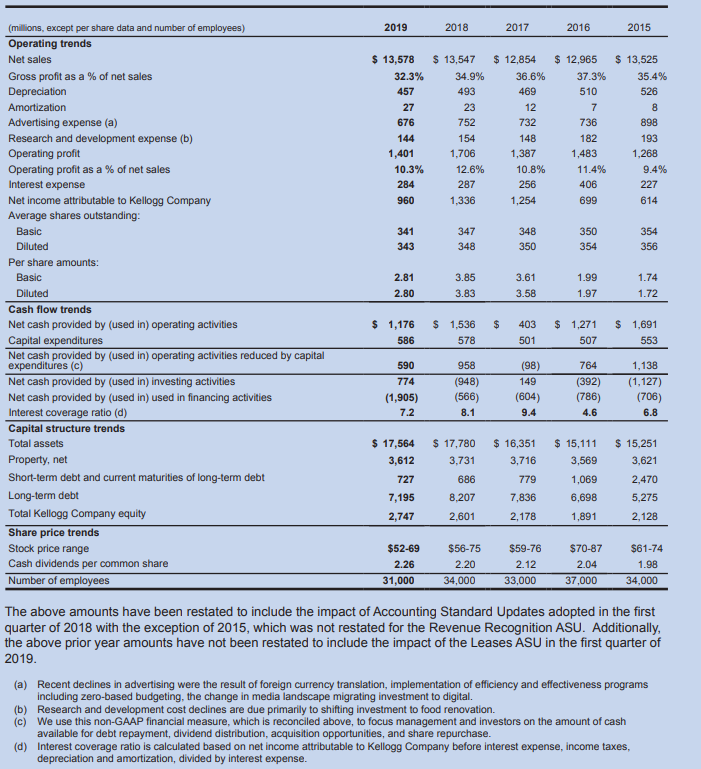
(millions, except per share data and number of employees) 2019 2018 2017 2016 2015 Operating trends Net sales $ 13,578 $ 13,547 $ 12,854 $ 12,965 $ 13,525 Gross profit as a % of net sales 32.3% 34.9% 36.6% 37.3% 35.4% Depreciation 457 493 469 510 526 Amortization 27 23 12 7 8 Advertising expense (a) 676 752 732 736 898 Research and development expense (b) 144 154 148 182 193 Operating profit 1,401 1,706 1,387 1,483 1,268 Operating profit as a % of net sales 10.3% 12.6% 10.8% 11.4% 9.4% Interest expense 284 287 256 406 227 Net income attributable to Kellogg Company 960 1,336 1,254 699 614 Average shares outstanding: Basic 341 347 348 350 354 Diluted 343 348 350 354 356 Per share amounts: Basic 2.81 3.85 3.61 1.99 1.74 Diluted 2.80 3.83 3.58 1.97 1.72 Cash flow trends Net cash provided by (used in) operating activities $ 1,176 $ 1,536 $ 403 $ 1,271 $ 1,691 Capital expenditures 586 578 501 507 553 Net cash provided by (used in) operating activities reduced by capital expenditures (c) 590 958 (98) 764 1,138 Net cash provided by (used in) investing activities 774 (948) 149 (392) (1,127) Net cash provided by (used in) used in financing activities (1,905) (566) (604) (786) (706) Interest coverage ratio (d) 7.2 8.1 9.4 4.6 6.8 Capital structure trends Total assets $ 17,564 $ 17,780 $ 16,351 $ 15,111 $ 15,251 Property, net 3,612 3,731 3,716 3,569 3,621 Short-term debt and current maturities of long-term debt 727 686 779 1,069 2,470 Long-term debt 7,195 8,207 7,836 6,698 5,275 Total Kellogg Company equity 2,747 2,601 2,178 1,891 2,128 Share price trends Stock price range $52-69 $56-75 $59-76 $70-87 $61-74 Cash dividends per common share 2.26 2.20 2.12 2.04 1.98 Number of employees 31,000 34,000 33,000 37,000 34,000 The above amounts have been restated to include the impact of Accounting Standard Updates adopted in the first quarter of 2018 with the exception of 2015, which was not restated for the Revenue Recognition ASU. Additionally, the above prior year amounts have not been restated to include the impact of the Leases ASU in the first quarter of 2019. (a) Recent declines in advertising were the result of foreign currency translation, implementation of efficiency and effectiveness programs including zero-based budgeting, the change in media landscape migrating investment to digital. (b) Research and development cost declines are due primarily to shifting investment to food renovation. (c) We use this non-GAAP financial measure, which is reconciled above, to focus management and investors on the amount of cash available for debt repayment, dividend distribution, acquisition opportunities, and share repurchase. (d) Interest coverage ratio is calculated based on net income attributable to Kellogg Company before interest expense, income taxes, depreciation and amortization, divided by interest expense. (millions, except per share data and number of employees) 2019 2018 2017 2016 2015 Operating trends Net sales $ 13,578 $ 13,547 $ 12,854 $ 12,965 $ 13,525 Gross profit as a % of net sales 32.3% 34.9% 36.6% 37.3% 35.4% Depreciation 457 493 469 510 526 Amortization 27 23 12 7 8 Advertising expense (a) 676 752 732 736 898 Research and development expense (b) 144 154 148 182 193 Operating profit 1,401 1,706 1,387 1,483 1,268 Operating profit as a % of net sales 10.3% 12.6% 10.8% 11.4% 9.4% Interest expense 284 287 256 406 227 Net income attributable to Kellogg Company 960 1,336 1,254 699 614 Average shares outstanding: Basic 341 347 348 350 354 Diluted 343 348 350 354 356 Per share amounts: Basic 2.81 3.85 3.61 1.99 1.74 Diluted 2.80 3.83 3.58 1.97 1.72 Cash flow trends Net cash provided by (used in) operating activities $ 1,176 $ 1,536 $ 403 $ 1,271 $ 1,691 Capital expenditures 586 578 501 507 553 Net cash provided by (used in) operating activities reduced by capital expenditures (c) 590 958 (98) 764 1,138 Net cash provided by (used in) investing activities 774 (948) 149 (392) (1,127) Net cash provided by (used in) used in financing activities (1,905) (566) (604) (786) (706) Interest coverage ratio (d) 7.2 8.1 9.4 4.6 6.8 Capital structure trends Total assets $ 17,564 $ 17,780 $ 16,351 $ 15,111 $ 15,251 Property, net 3,612 3,731 3,716 3,569 3,621 Short-term debt and current maturities of long-term debt 727 686 779 1,069 2,470 Long-term debt 7,195 8,207 7,836 6,698 5,275 Total Kellogg Company equity 2,747 2,601 2,178 1,891 2,128 Share price trends Stock price range $52-69 $56-75 $59-76 $70-87 $61-74 Cash dividends per common share 2.26 2.20 2.12 2.04 1.98 Number of employees 31,000 34,000 33,000 37,000 34,000 The above amounts have been restated to include the impact of Accounting Standard Updates adopted in the first quarter of 2018 with the exception of 2015, which was not restated for the Revenue Recognition ASU. Additionally, the above prior year amounts have not been restated to include the impact of the Leases ASU in the first quarter of 2019. (a) Recent declines in advertising were the result of foreign currency translation, implementation of efficiency and effectiveness programs including zero-based budgeting, the change in media landscape migrating investment to digital. (b) Research and development cost declines are due primarily to shifting investment to food renovation. (c) We use this non-GAAP financial measure, which is reconciled above, to focus management and investors on the amount of cash available for debt repayment, dividend distribution, acquisition opportunities, and share repurchase. (d) Interest coverage ratio is calculated based on net income attributable to Kellogg Company before interest expense, income taxes, depreciation and amortization, divided by interest expenseStep by Step Solution
There are 3 Steps involved in it
Step: 1

Get Instant Access to Expert-Tailored Solutions
See step-by-step solutions with expert insights and AI powered tools for academic success
Step: 2

Step: 3
Ace Your Homework with AI
Get the answers you need in no time with our AI-driven, step-by-step assistance
Get Started
Problems In State High School Finance
Authors: Julian Edward Butterworth
1st Edition
0554798298, 9780554798295