Question
Attach the necessary SPSS output table if you used SPSS for the questions. Q1. There is a randomly selected sample of 20-year-old, 6-foot-1-inch males from
Attach the necessary SPSS output table if you used SPSS for the questions.
Q1. There is a randomly selected sample of 20-year-old, 6-foot-1-inch males from Minnesota. This sample of 20 males had a mean weight of 180 lb. Based on this sample, are Minnesota males heavier than males in general? The mean weight of all U.S. males (6'1'') is 175 lb., and the population standard deviation is 10 lb. Assume a normal distribution for the weight.
1) What statistical procedure can be used? Explain why.
2) Use ? = 0.05, and both rejection region and p-valueto make a decision.
Q2. Suppose the incidence rate of myocardial infarction (MI) was 10 per 1000 among 45- to 54-year-old men in 1990. To look at changes in incidence over time, 3000 men in this age group were followed for 1 year starting in 2000. 40 new cases of MI were found. Using both rejection region and p-value with ? = .05, test the hypothesis that incidence rates of MI changed from 1990 to 2000.
Q3. A company labeled its can soup with 800mg sodium per serving. A consumers' group is concerned that the soup contains less sodium than what is listed on the can. A sample of 49 cans had a mean sodium content of 840 mg per serving and a sample standard deviation of 35 mg. Do the cans contain less than the 800 mg of sodium per serving listed on the label? Assume the population of the amount of sodium per serving is following a normal distribution.
1) What statistical procedure can be used? Explain why.
2) Use ? = 0.05, and both rejection region and p-valueto make a decision.
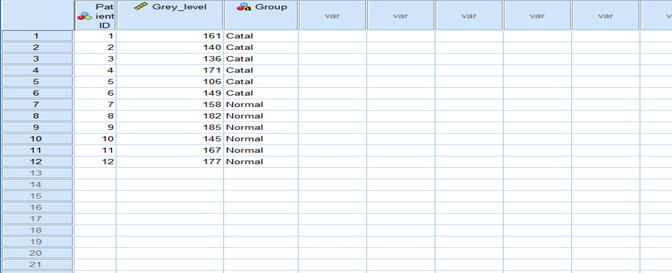
Q4. A camera has been developed to detect the presence of cataract more accurately. Using this camera, the gray level of each point (or pixel) in the lens of a human eye can be characterized into 256 gradations, where a gray level of 1 represents black and a gray level of 256 represents white. To test the camera, photographs were taken of 6 randomly selected normal eyes and 6 randomly selected cataractous eyes (the two groups consist of different people). The median gray level of each eye was computed over the 10,000+ pixels in the lens. The data are given


Step by Step Solution
There are 3 Steps involved in it
Step: 1

Get Instant Access to Expert-Tailored Solutions
See step-by-step solutions with expert insights and AI powered tools for academic success
Step: 2

Step: 3

Ace Your Homework with AI
Get the answers you need in no time with our AI-driven, step-by-step assistance
Get Started


