 Australian listed company Nick Scali Limited (ASX ticker: NCK).
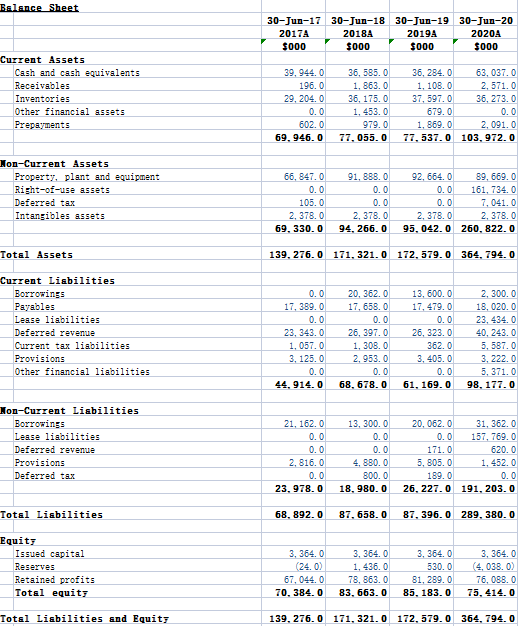
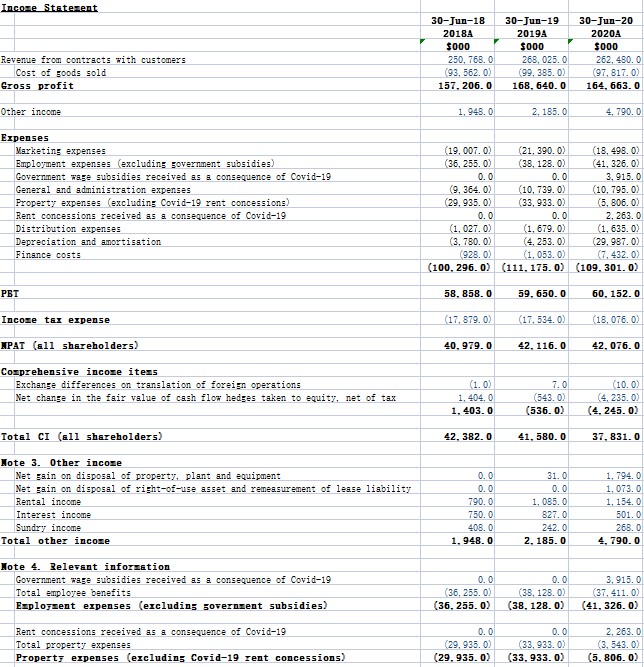
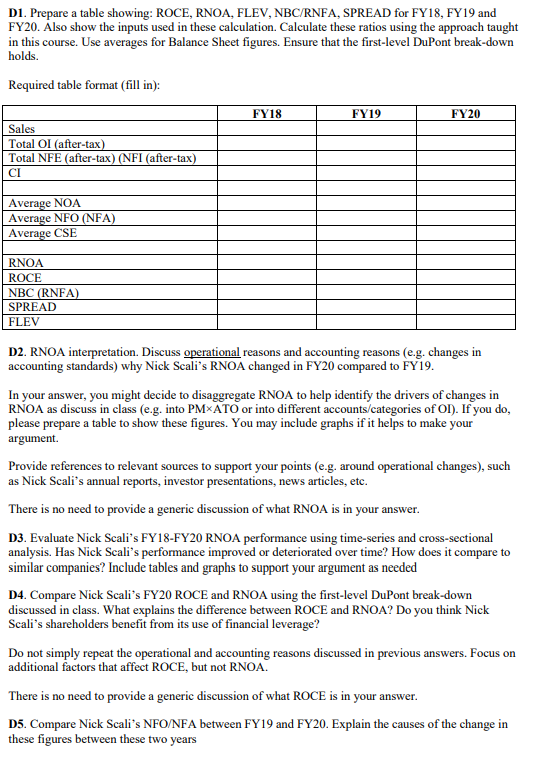
Balance Sheet 30-Jun-17 30-Jun-18 30-Jun-19 30-Jun-20 2017A 2018A 2019A 2020A $000 $000 $000 $000 Current Assets Cash and cash equivalents Receivables Inventories Other financial assets Prepayments 39, 944.0 196.0 29, 204.0 0.0 602.0 69, 946.0 36, 585.0 1,863.0 36, 175.0 1. 453.0 979.0 77, 055.0 36, 284.0 63,037.0 1, 108.0 2, 5710 37, 5970 36, 273.0 679.0 0.0 1,869.0 2,091.0 77,537.0 103, 972.0 Non-Current Assets Property, plant and equipment Right-of-use assets Deferred tax Intangibles assets 66,847.0 0.0 105.0 2, 378.0 69, 330.0 91,888.0 0.0 0.0 2, 378.0 94, 266.0 92, 664.0 89, 669.0 0.0 161, 734.0 0.0 7.041.0 2. 378.0 2, 378.0 95. 042.0 260, 822.0 Total Assets 139, 276.0 171, 321.0 172, 579.0 364, 794. O Current Liabilities Borrowings Payables Lease liabilities Deferred revenue Current tax liabilities Provisions Other financial liabilities 0.0 17, 389.0 0.0 23, 343.0 1.057.0 3, 125.0 0.0 44.914.0 20, 362.0 17, 658.0 0.0 26, 397.0 1. 308.0 2,953.0 0.0 68, 678.0 13,600.0 17, 479.0 0.0 26, 323.0 362.0 3,405.0 0.0 61, 169.0 2,300.0 18,020.0 23, 434.0 40, 243.0 5,587.0 3, 222.0 5, 371.0 98. 177.0 Non-Current Liabilities Borrowings Lease liabilities Deferred revenue Provisions Deferred tax 21, 162.0 0.0 0.0 2. 816.0 0.0 23.978.0 13, 300.0 0.0 0.0 4, 880.0 800.0 18, 980.0 20. 062.0 31, 362.0 0.0 157, 769.0 171.0 620.0 5, 805.0 1, 452.0 189.0 0.0 26, 227.0 191, 203.0 Total Liabilities 68, 892.0 87, 658.0 87, 396.0 289, 380. O Equity Issued capital Reserves Retained profits Total equity 3, 364.0 (24.0) 67, 044.0 70, 384.0 3, 364.0 1, 436.0 78,863.0 83, 663.0 3,364.0 530.0 81, 289.0 85, 183.0 3,364.0 (4,038.0 76,088.0 75, 414.0 Total Liabilities and Equity 139, 276.0 171, 321.0 172, 579.0 364, 794. O Incoze Statezent 30-Jun-18 2018A $000 250, 768.0 (93,562.0) 157, 206.0 30-Jun-19 2019A $000 268.025.0 (99,385.0) 168, 640.0 30-Jun-20 2020A $000 262, 480.0 (97, 817.0) 164, 663.0 Revenue from contracts with customers Cost of goods sold Gross profit Other income 1.948.0 2, 185.0 4, 790.0 Expenses Marketing expenses Employment expenses (excluding government subsidies) Government wage subsidies received as a consequence of Covid-19 General and administration expenses Property expenses (excluding Covid-19 rent concessions) Rent concessions received as a consequence of Covid-19 Distribution expenses Depreciation and amortisation Finance costs (19,007.0) (21, 390.0) (18,498.0) (36, 255.0) (38, 128.0) (41, 326.0) 0.0 0.0 3,915.0 (9,364.0) (10, 739.0) (10, 795.0) (29, 935.0) (33,933.0) (5, 806.0) 0.0 0.0 2.263.0 (1,027.0) (1.679.0) (1,635.0) (3, 780.0) (4,253.0) (29, 987.0) (928.0) (1,053.0) (7, 432.0) (100, 296.0) (111,175.0) (109,301.0) PBT 58.858.0 59.650.0 60. 152.0 Incose tax expense (17,879.0) (17,534.0) (18,076.0) NPAT (all shareholders) 40,979.0 42, 116.0 42, 076.0 Cozprehensive incose itess Exchange differences on translation of foreign operations Net change in the fair value of cash flow hedges taken to equity, net of tax (1.0) 1, 404.0 1. 403.0 7.0 (543.0) (536.0) (10.0) (4,235.0) (4.245.0) Total CI (all shareholders) 42, 382.0 41, 580.0 37, 831.0 Note 3. Other incose Net gain on disposal of property, plant and equipment Net gain on disposal of right-of-use asset and remessurement of lease liability Rental income Interest income Sundry income Total other incoze 0.0 0.0 790.0 750.0 408.0 1,948.0 31.0 0.0 1,085.0 8270 242.0 2, 185.0 1, 794.0 1, 073.0 1. 154.0 501.0 268.0 4, 790.0 Note 4. Relevant inforzation Government wage subsidies received as a consequence of Covid-19 Total employee benefits Explozent expenses (excluding governzent subsidies) 0.0 (36, 255.0) (36,255.0) 0.0 (38, 128.0) (38. 128.02 3,915.0 (37, 411.0) (41, 326.0) Rent concessions received as a consequence of Covid-19 Total property expenses Property expenses (excluding Covid-19 rent concessions) 0.0 (29,935.0) (29,935. 02 0.0 (33,933.0) (33,933.0) 2, 263.0 (3, 543.0) (5.806.0) D1. Prepare a table showing: ROCE, RNOA, FLEV, NBC/RNFA, SPREAD for FY18, FY19 and FY20. Also show the inputs used in these calculation. Calculate these ratios using the approach taught in this course. Use averages for Balance Sheet figures. Ensure that the first-level DuPont break-down holds. Required table format (fill in): FY18 FY19 FY20 Sales Total OI (after-tax) Total NFE (after-tax) (NFI (after-tax) CI Average NOA Average NFO (NFA) Average CSE RNOA ROCE NBC (RNFA) SPREAD FLEV D2. RNOA interpretation. Discuss operational reasons and accounting reasons (e.g. changes in accounting standards) why Nick Scali's RNOA changed in FY20 compared to FY19. In your answer, you might decide to disaggregate RNOA to help identify the drivers of changes in RNOA as discuss in class (e.g. into PM ATO or into different accounts/categories of OI). If you do, please prepare a table to show these figures. You may include graphs if it helps to make your argument. Provide references to relevant sources to support your points (e.g. around operational changes), such as Nick Scali's annual reports, investor presentations, news articles, etc. There is no need to provide a generic discussion of what RNOA is in your answer. D3. Evaluate Nick Scali's FY18-FY20 RNOA performance using time-series and cross-sectional analysis. Has Nick Scali's performance improved or deteriorated over time? How does it compare to similar companies? Include tables and graphs to support your argument as needed D4. Compare Nick Scali's FY20 ROCE and RNOA using the first-level DuPont break-down discussed in class. What explains the difference between ROCE and RNOA? Do you think Nick Scali's shareholders benefit from its use of financial leverage? Do not simply repeat the operational and accounting reasons discussed in previous answers. Focus on additional factors that affect ROCE, but not RNOA There is no need to provide a generic discussion of what ROCE is in your answer. D5. Compare Nick Scali's NFO/NFA between FY19 and FY20. Explain the causes of the change in these figures between these two years Balance Sheet 30-Jun-17 30-Jun-18 30-Jun-19 30-Jun-20 2017A 2018A 2019A 2020A $000 $000 $000 $000 Current Assets Cash and cash equivalents Receivables Inventories Other financial assets Prepayments 39, 944.0 196.0 29, 204.0 0.0 602.0 69, 946.0 36, 585.0 1,863.0 36, 175.0 1. 453.0 979.0 77, 055.0 36, 284.0 63,037.0 1, 108.0 2, 5710 37, 5970 36, 273.0 679.0 0.0 1,869.0 2,091.0 77,537.0 103, 972.0 Non-Current Assets Property, plant and equipment Right-of-use assets Deferred tax Intangibles assets 66,847.0 0.0 105.0 2, 378.0 69, 330.0 91,888.0 0.0 0.0 2, 378.0 94, 266.0 92, 664.0 89, 669.0 0.0 161, 734.0 0.0 7.041.0 2. 378.0 2, 378.0 95. 042.0 260, 822.0 Total Assets 139, 276.0 171, 321.0 172, 579.0 364, 794. O Current Liabilities Borrowings Payables Lease liabilities Deferred revenue Current tax liabilities Provisions Other financial liabilities 0.0 17, 389.0 0.0 23, 343.0 1.057.0 3, 125.0 0.0 44.914.0 20, 362.0 17, 658.0 0.0 26, 397.0 1. 308.0 2,953.0 0.0 68, 678.0 13,600.0 17, 479.0 0.0 26, 323.0 362.0 3,405.0 0.0 61, 169.0 2,300.0 18,020.0 23, 434.0 40, 243.0 5,587.0 3, 222.0 5, 371.0 98. 177.0 Non-Current Liabilities Borrowings Lease liabilities Deferred revenue Provisions Deferred tax 21, 162.0 0.0 0.0 2. 816.0 0.0 23.978.0 13, 300.0 0.0 0.0 4, 880.0 800.0 18, 980.0 20. 062.0 31, 362.0 0.0 157, 769.0 171.0 620.0 5, 805.0 1, 452.0 189.0 0.0 26, 227.0 191, 203.0 Total Liabilities 68, 892.0 87, 658.0 87, 396.0 289, 380. O Equity Issued capital Reserves Retained profits Total equity 3, 364.0 (24.0) 67, 044.0 70, 384.0 3, 364.0 1, 436.0 78,863.0 83, 663.0 3,364.0 530.0 81, 289.0 85, 183.0 3,364.0 (4,038.0 76,088.0 75, 414.0 Total Liabilities and Equity 139, 276.0 171, 321.0 172, 579.0 364, 794. O Incoze Statezent 30-Jun-18 2018A $000 250, 768.0 (93,562.0) 157, 206.0 30-Jun-19 2019A $000 268.025.0 (99,385.0) 168, 640.0 30-Jun-20 2020A $000 262, 480.0 (97, 817.0) 164, 663.0 Revenue from contracts with customers Cost of goods sold Gross profit Other income 1.948.0 2, 185.0 4, 790.0 Expenses Marketing expenses Employment expenses (excluding government subsidies) Government wage subsidies received as a consequence of Covid-19 General and administration expenses Property expenses (excluding Covid-19 rent concessions) Rent concessions received as a consequence of Covid-19 Distribution expenses Depreciation and amortisation Finance costs (19,007.0) (21, 390.0) (18,498.0) (36, 255.0) (38, 128.0) (41, 326.0) 0.0 0.0 3,915.0 (9,364.0) (10, 739.0) (10, 795.0) (29, 935.0) (33,933.0) (5, 806.0) 0.0 0.0 2.263.0 (1,027.0) (1.679.0) (1,635.0) (3, 780.0) (4,253.0) (29, 987.0) (928.0) (1,053.0) (7, 432.0) (100, 296.0) (111,175.0) (109,301.0) PBT 58.858.0 59.650.0 60. 152.0 Incose tax expense (17,879.0) (17,534.0) (18,076.0) NPAT (all shareholders) 40,979.0 42, 116.0 42, 076.0 Cozprehensive incose itess Exchange differences on translation of foreign operations Net change in the fair value of cash flow hedges taken to equity, net of tax (1.0) 1, 404.0 1. 403.0 7.0 (543.0) (536.0) (10.0) (4,235.0) (4.245.0) Total CI (all shareholders) 42, 382.0 41, 580.0 37, 831.0 Note 3. Other incose Net gain on disposal of property, plant and equipment Net gain on disposal of right-of-use asset and remessurement of lease liability Rental income Interest income Sundry income Total other incoze 0.0 0.0 790.0 750.0 408.0 1,948.0 31.0 0.0 1,085.0 8270 242.0 2, 185.0 1, 794.0 1, 073.0 1. 154.0 501.0 268.0 4, 790.0 Note 4. Relevant inforzation Government wage subsidies received as a consequence of Covid-19 Total employee benefits Explozent expenses (excluding governzent subsidies) 0.0 (36, 255.0) (36,255.0) 0.0 (38, 128.0) (38. 128.02 3,915.0 (37, 411.0) (41, 326.0) Rent concessions received as a consequence of Covid-19 Total property expenses Property expenses (excluding Covid-19 rent concessions) 0.0 (29,935.0) (29,935. 02 0.0 (33,933.0) (33,933.0) 2, 263.0 (3, 543.0) (5.806.0) D1. Prepare a table showing: ROCE, RNOA, FLEV, NBC/RNFA, SPREAD for FY18, FY19 and FY20. Also show the inputs used in these calculation. Calculate these ratios using the approach taught in this course. Use averages for Balance Sheet figures. Ensure that the first-level DuPont break-down holds. Required table format (fill in): FY18 FY19 FY20 Sales Total OI (after-tax) Total NFE (after-tax) (NFI (after-tax) CI Average NOA Average NFO (NFA) Average CSE RNOA ROCE NBC (RNFA) SPREAD FLEV D2. RNOA interpretation. Discuss operational reasons and accounting reasons (e.g. changes in accounting standards) why Nick Scali's RNOA changed in FY20 compared to FY19. In your answer, you might decide to disaggregate RNOA to help identify the drivers of changes in RNOA as discuss in class (e.g. into PM ATO or into different accounts/categories of OI). If you do, please prepare a table to show these figures. You may include graphs if it helps to make your argument. Provide references to relevant sources to support your points (e.g. around operational changes), such as Nick Scali's annual reports, investor presentations, news articles, etc. There is no need to provide a generic discussion of what RNOA is in your answer. D3. Evaluate Nick Scali's FY18-FY20 RNOA performance using time-series and cross-sectional analysis. Has Nick Scali's performance improved or deteriorated over time? How does it compare to similar companies? Include tables and graphs to support your argument as needed D4. Compare Nick Scali's FY20 ROCE and RNOA using the first-level DuPont break-down discussed in class. What explains the difference between ROCE and RNOA? Do you think Nick Scali's shareholders benefit from its use of financial leverage? Do not simply repeat the operational and accounting reasons discussed in previous answers. Focus on additional factors that affect ROCE, but not RNOA There is no need to provide a generic discussion of what ROCE is in your answer. D5. Compare Nick Scali's NFO/NFA between FY19 and FY20. Explain the causes of the change in these figures between these two years