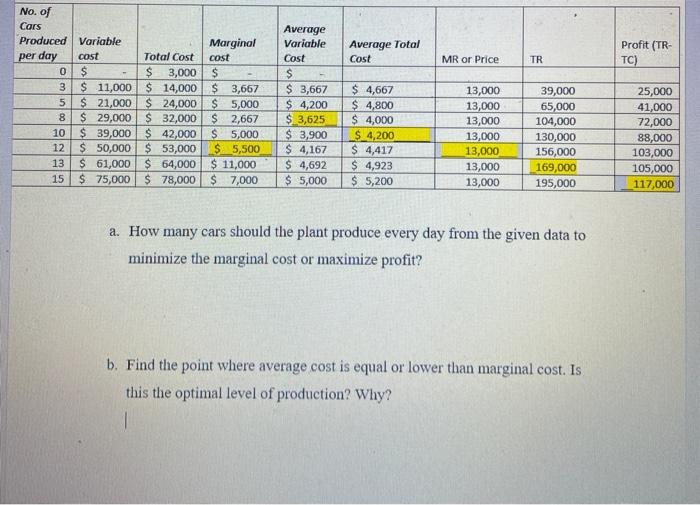
Average Total Cost MR or Price TR Profit (TR- TC) No. of Cars Produced Variable Marginal per day cost Total Cost cost 0 $ $ 3,000 $ 3 $ 11,000 $ 14,000 $3,667 5 $ 21,000 $ 24,000 $ 5,000 8 $ 29,000$ 32,000 $ 2,667 10 $ 39,000 $ 42,000 $ 5,000 12 $ 50,000 $ 53,000 $5,500 13 $ 61,000 $ 64,000 $ 11,000 15 $ 75,000 $ 78,000 $ 7,000 Average Variable Cost $ $ 3,667 $ 4,200 $ 3,625 $ 3,900 $ 4,167 $4,692 $ 5,000 $ 4,667 $ 4,800 $ 4,000 $ 4,200 $ 4,417 $ 4,923 $ 5,200 13,000 13,000 13,000 13,000 13,000 13,000 13,000 39,000 65,000 104,000 130,000 156,000 169,000 195,000 25,000 41,000 72,000 88,000 103,000 105,000 117,000 a. How many cars shoul plant produce every day from the given data to minimize the marginal cost or maximize profit? b. Find the point where average cost is equal or lower than marginal cost. Is this the optimal level of production? Why? | Average Total Cost MR or Price TR Profit (TR- TC) No. of Cars Produced Variable Marginal per day cost Total Cost cost 0 $ $ 3,000 $ 3 $ 11,000 $ 14,000 $3,667 5 $ 21,000 $ 24,000 $ 5,000 8 $ 29,000$ 32,000 $ 2,667 10 $ 39,000 $ 42,000 $ 5,000 12 $ 50,000 $ 53,000 $5,500 13 $ 61,000 $ 64,000 $ 11,000 15 $ 75,000 $ 78,000 $ 7,000 Average Variable Cost $ $ 3,667 $ 4,200 $ 3,625 $ 3,900 $ 4,167 $4,692 $ 5,000 $ 4,667 $ 4,800 $ 4,000 $ 4,200 $ 4,417 $ 4,923 $ 5,200 13,000 13,000 13,000 13,000 13,000 13,000 13,000 39,000 65,000 104,000 130,000 156,000 169,000 195,000 25,000 41,000 72,000 88,000 103,000 105,000 117,000 a. How many cars shoul plant produce every day from the given data to minimize the marginal cost or maximize profit? b. Find the point where average cost is equal or lower than marginal cost. Is this the optimal level of production? Why? |