Answered step by step
Verified Expert Solution
Question
1 Approved Answer
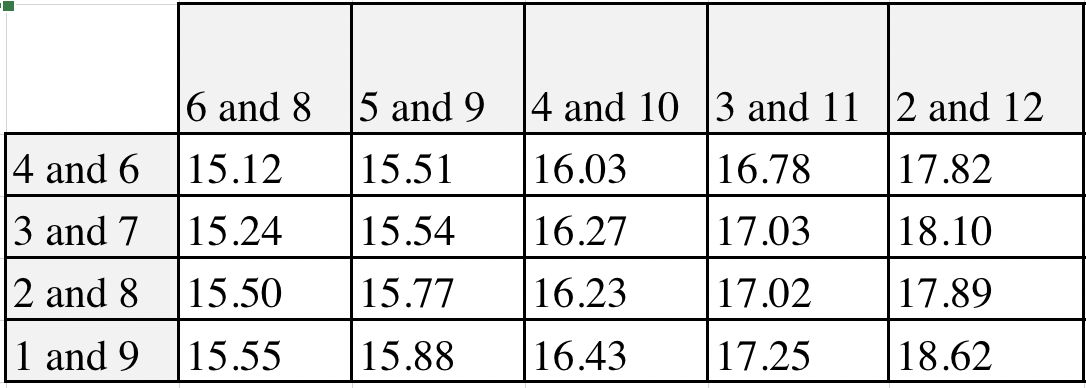
Average Travel Time of Based on Different Varying Stop and Clear Times. The top row is the varying clear times ( for example clear time
Average Travel Time of Based on Different Varying Stop and Clear Times. The top row is the varying clear times for example clear time was either seconds or seconds and the left most column is varying stop times. Display this data on a graph of your choice. Use microsoft excel to make the graph.
IF YOU DO NOT ACTUALLY MAKE THE GRAPH THIS WILL BE "THUMBS DOWNED"
If you answer this question you MUST provide a graph from microsoft excel.

Step by Step Solution
There are 3 Steps involved in it
Step: 1

Get Instant Access to Expert-Tailored Solutions
See step-by-step solutions with expert insights and AI powered tools for academic success
Step: 2

Step: 3

Ace Your Homework with AI
Get the answers you need in no time with our AI-driven, step-by-step assistance
Get Started


