

Answered step by step
Verified Expert Solution
Question
1 Approved Answer
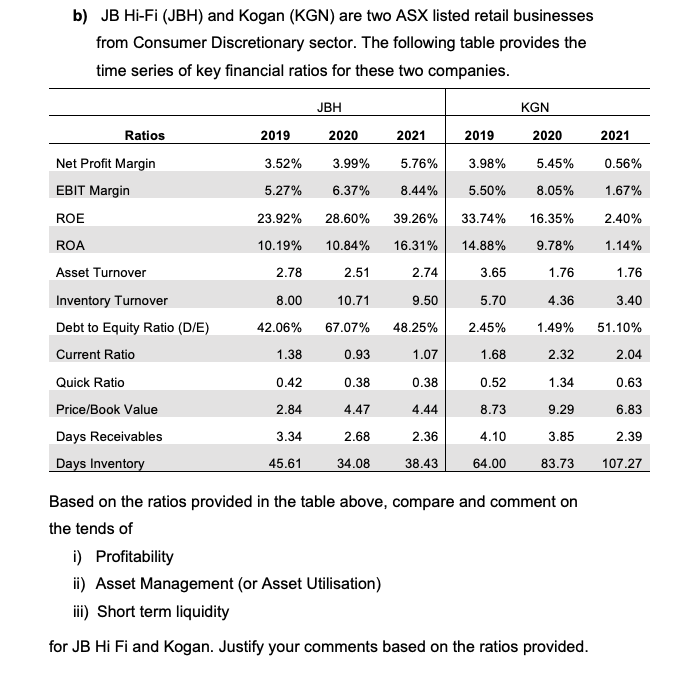
b) JB Hi-Fi (JBH) and Kogan (KGN) are two ASX listed retail businesses from Consumer Discretionary sector. The following table provides the time series of
Step by Step Solution
There are 3 Steps involved in it
Step: 1

Get Instant Access to Expert-Tailored Solutions
See step-by-step solutions with expert insights and AI powered tools for academic success
Step: 2

Step: 3
Ace Your Homework with AI
Get the answers you need in no time with our AI-driven, step-by-step assistance
Get Started
Ziglar On Selling The Ultimate Handbook For The Complete Sales Professional
Authors: Zig Ziglar
1st Edition
0785288937, 978-0785288930