Answered step by step
Verified Expert Solution
Question
1 Approved Answer
Balance productions and attractions based on the data contained in Tables 1 and 2. Also, use the same weighed averages as well as the same
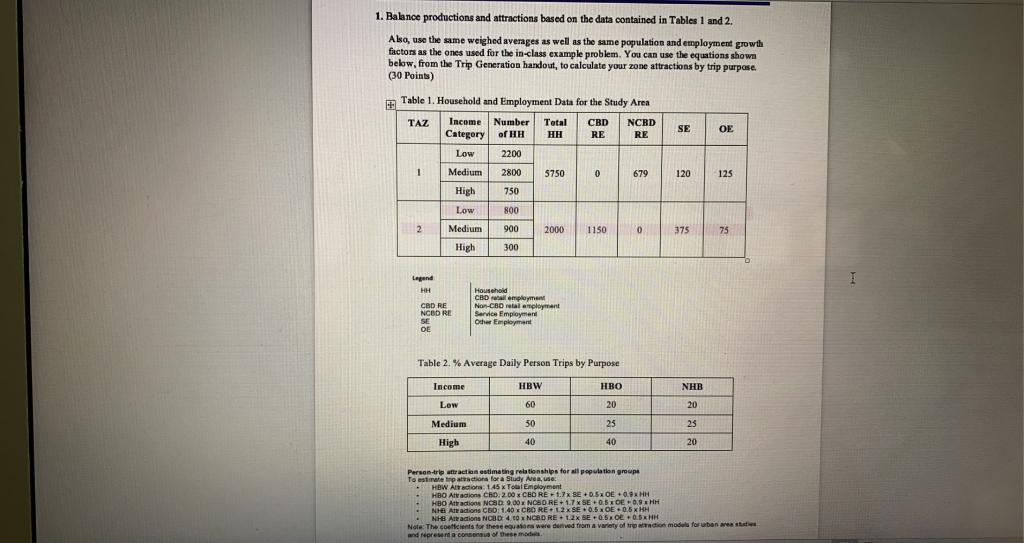
 Balance productions and attractions based on the data contained in Tables 1 and 2.
Also, use the same weighed averages as well as the same population and employment growth factors as the ones used for the in-class example problem. You can use the equations shown below, from the Trip Generation handout, to calculate your zone attractions by trip purpose.
1. Balance productions and attractions based on the data contained in Tables 1 and 2. Also, use the same weighed averages as well as the same population and employment growth factors as the ones used for the in-class example problem. You can use the equations shown -. below, from the Trip Generation handout, to calculate your zone attractions by trip purpose. (30 Points) SE OE Table 1. Household and Employment Data for the Study Area TAZ Income Number Total CBD NCBD Category of HH HH RE RE Low 2200 1 Medium 2800 5750 0 679 High 750 120 125 800 Low Medium 2 900 2000 1150 0 0 375 75 High 300 Legend HH CAD RE NGOD RE SE OE Household CBD mail employment Non-CBD tal amployment Service Employment Other Employment Table 2. % Average Daily Person Trips by Purpose Income HBW HBO NHB Low 60 20 20 50 25 23 Medium High 40 40 20 Person-tre attraction estimating relationships for all population groupe To estimate trp atractions for a Study Area, use HEW Arteo 145 xToul Employment - HBO AttadionsCHO:2.00 X CBO RE 1.7 x SE 0.5xOE 0.9X HH HBO Attractions NCBD 9.00 NOSO RE+1.7 x SE+0.5 DE 09HH . NHE Atractions CEO:1.40 CBO RE+ 12xSE 0.5xOE05 HH NHB Attractions NCBD 40 x NCBD RE 1.2x SE+0.5X OE05HH Note: The coeficients for these equations were derived from a variety of tratacion model foruten and prewed cons of these mod 1. Balance productions and attractions based on the data contained in Tables 1 and 2. Also, use the same weighed averages as well as the same population and employment growth factors as the ones used for the in-class example problem. You can use the equations shown -. below, from the Trip Generation handout, to calculate your zone attractions by trip purpose. (30 Points) SE OE Table 1. Household and Employment Data for the Study Area TAZ Income Number Total CBD NCBD Category of HH HH RE RE Low 2200 1 Medium 2800 5750 0 679 High 750 120 125 800 Low Medium 2 900 2000 1150 0 0 375 75 High 300 Legend HH CAD RE NGOD RE SE OE Household CBD mail employment Non-CBD tal amployment Service Employment Other Employment Table 2. % Average Daily Person Trips by Purpose Income HBW HBO NHB Low 60 20 20 50 25 23 Medium High 40 40 20 Person-tre attraction estimating relationships for all population groupe To estimate trp atractions for a Study Area, use HEW Arteo 145 xToul Employment - HBO AttadionsCHO:2.00 X CBO RE 1.7 x SE 0.5xOE 0.9X HH HBO Attractions NCBD 9.00 NOSO RE+1.7 x SE+0.5 DE 09HH . NHE Atractions CEO:1.40 CBO RE+ 12xSE 0.5xOE05 HH NHB Attractions NCBD 40 x NCBD RE 1.2x SE+0.5X OE05HH Note: The coeficients for these equations were derived from a variety of tratacion model foruten and prewed cons of these modStep by Step Solution
There are 3 Steps involved in it
Step: 1

Get Instant Access to Expert-Tailored Solutions
See step-by-step solutions with expert insights and AI powered tools for academic success
Step: 2

Step: 3

Ace Your Homework with AI
Get the answers you need in no time with our AI-driven, step-by-step assistance
Get Started


