Answered step by step
Verified Expert Solution
Question
1 Approved Answer
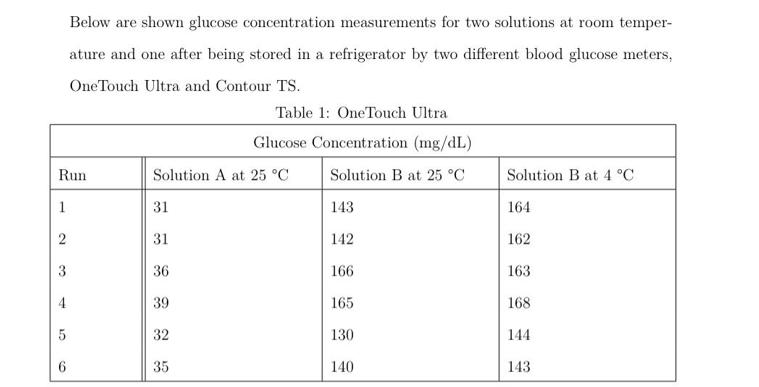
Below are shown glucose concentration measurements for two solutions at room temper- ature and one after being stored in a refrigerator by two different


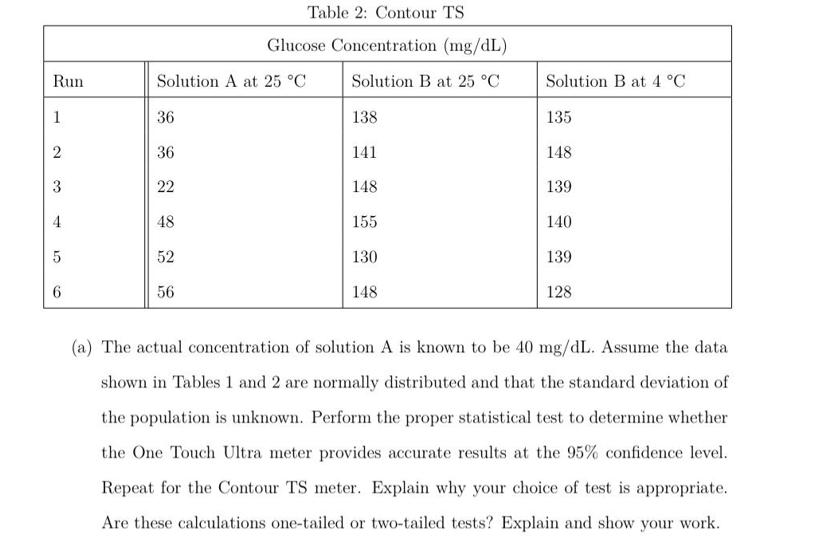
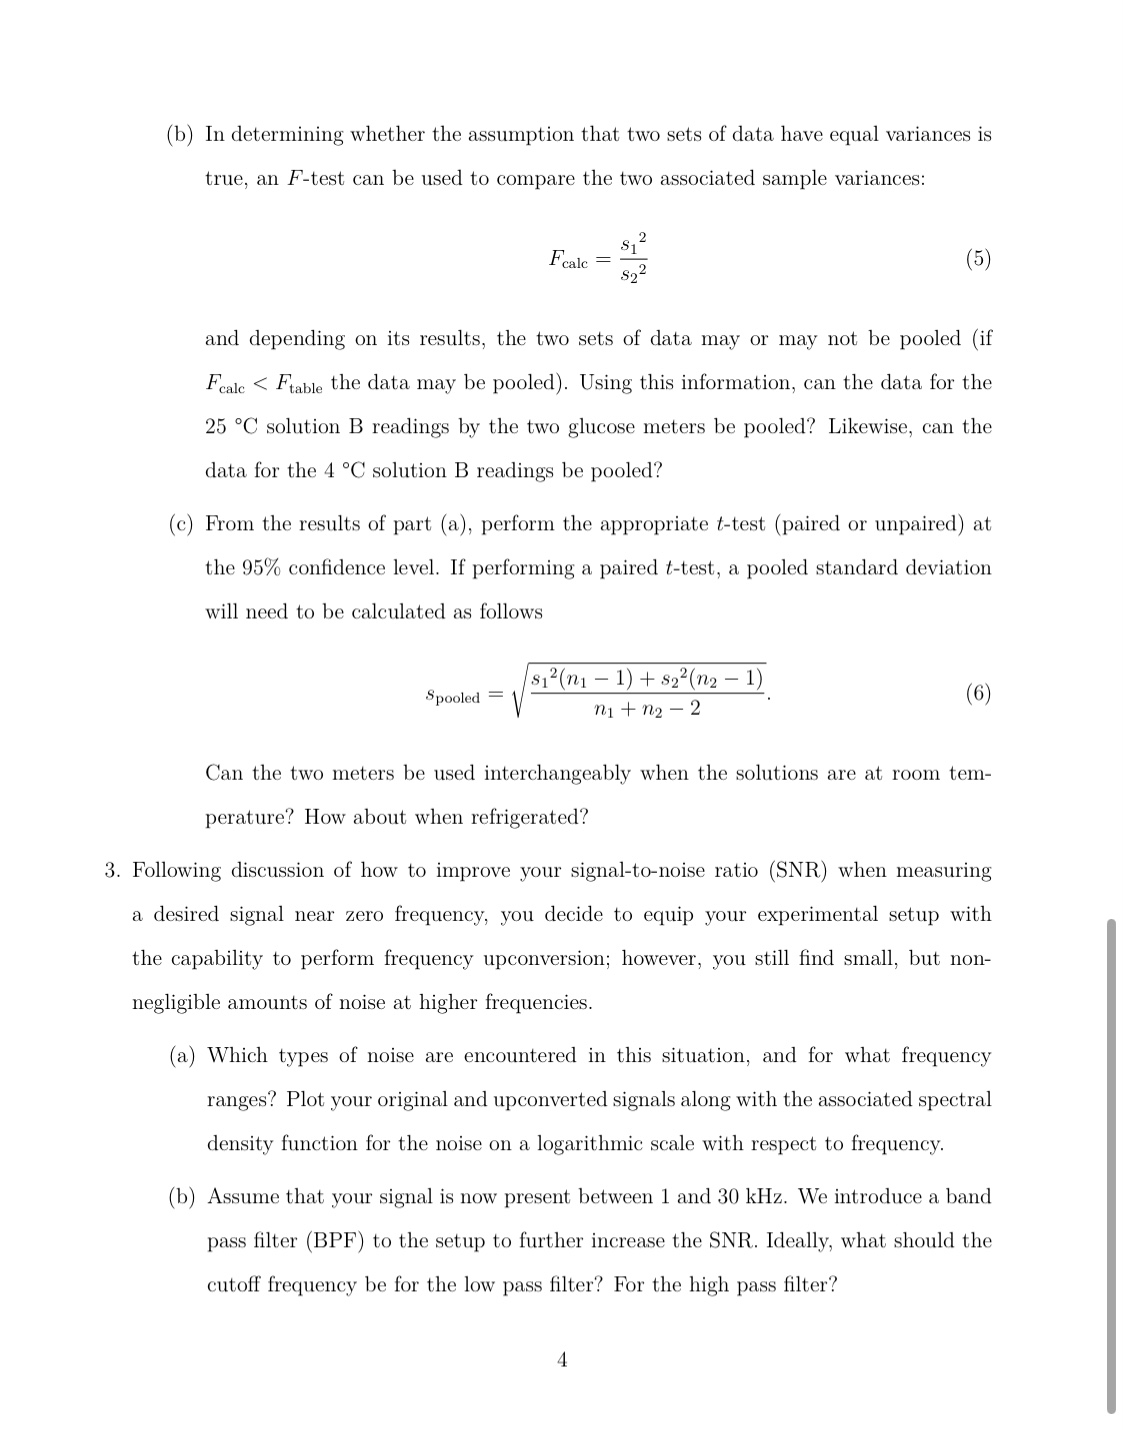
Below are shown glucose concentration measurements for two solutions at room temper- ature and one after being stored in a refrigerator by two different blood glucose meters, One Touch Ultra and Contour TS. Table 1: One Touch Ultra Glucose Concentration (mg/dL) Run Solution A at 25 C Solution B at 25 C Solution B at 4 C 1 31 143 164 2 31 142 162 3 36 166 163 4 39 165 168 5 32 130 144 6 35 140 143 Table 2: Contour TS Glucose Concentration (mg/dL) Run Solution A at 25 C Solution B at 25 C Solution B at 4 C 1 36 138 135 2 36 141 148 3 22 148 139 4 48 155 140 5 52 130 139 6 56 148 128 (a) The actual concentration of solution A is known to be 40 mg/dL. Assume the data shown in Tables 1 and 2 are normally distributed and that the standard deviation of the population is unknown. Perform the proper statistical test to determine whether the One Touch Ultra meter provides accurate results at the 95% confidence level. Repeat for the Contour TS meter. Explain why your choice of test is appropriate. Are these calculations one-tailed or two-tailed tests? Explain and show your work. (b) In determining whether the assumption that two sets of data have equal variances is true, an F-test can be used to compare the two associated sample variances: Fcalc $1 82 and depending on its results, the two sets of data may or may not be pooled (if Fcalc Ftable the data may be pooled). Using this information, can the data for the 25 C solution B readings by the two glucose meters be pooled? Likewise, can the data for the 4 C solution B readings be pooled? (c) From the results of part (a), perform the appropriate t-test (paired or unpaired) at the 95% confidence level. If performing a paired t-test, a pooled standard deviation will need to be calculated as follows Spooled = 812(n - 1) + 822 (n2 - 1 n1n2-2 Can the two meters be used interchangeably when the solutions are at room tem- perature? How about when refrigerated? 3. Following discussion of how to improve your signal-to-noise ratio (SNR) when measuring a desired signal near zero frequency, you decide to equip your experimental setup with the capability to perform frequency upconversion; however, you still find small, but non- negligible amounts of noise at higher frequencies. (a) Which types of noise are encountered in this situation, and for what frequency ranges? Plot your original and upconverted signals along with the associated spectral density function for the noise on a logarithmic scale with respect to frequency. (b) Assume that your signal is now present between 1 and 30 kHz. We introduce a band pass filter (BPF) to the setup to further increase the SNR. Ideally, what should the cutoff frequency be for the low pass filter? For the high pass filter? 4
Step by Step Solution
There are 3 Steps involved in it
Step: 1

Get Instant Access to Expert-Tailored Solutions
See step-by-step solutions with expert insights and AI powered tools for academic success
Step: 2

Step: 3

Ace Your Homework with AI
Get the answers you need in no time with our AI-driven, step-by-step assistance
Get Started


