

Question
Below table shows financial statement of company A and B: 1. What is your estimation of Total Revenue of the company B and what is
Below table shows financial statement of company A and B:
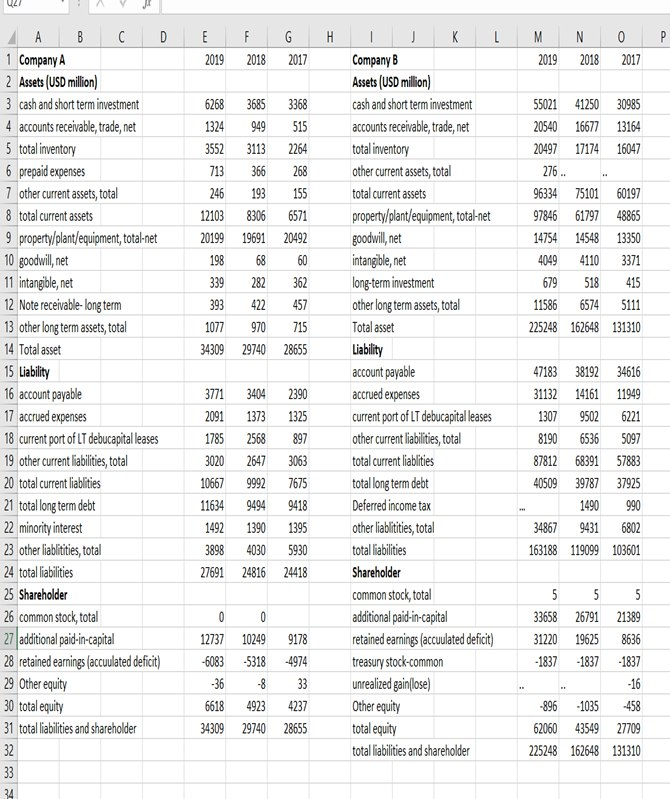
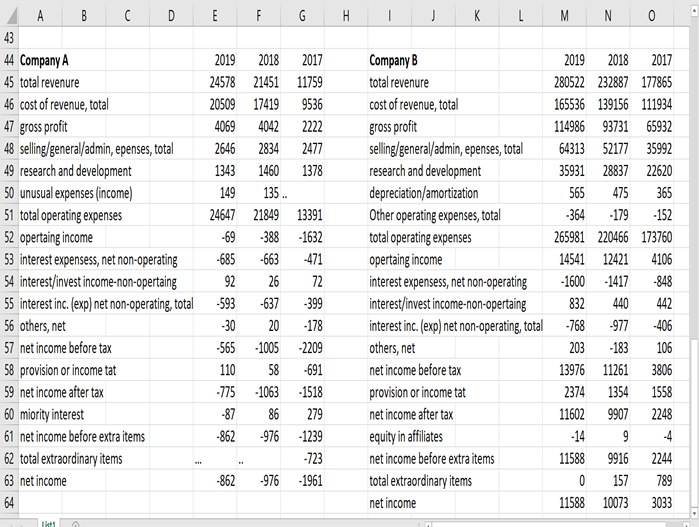
1. What is your estimation of Total Revenue of the company B and what is your estimation of the Total Cost and Revenue of the company B in the following year 2020 ? please be detail about the estimation calculation in 2020
2. As an investor, which of the companies would you prefer to invest in? Name and explain the reasons
3. Is the A companys net investment in fixed assets negative or positive? Give evidence. How does it impact the capacity of the company?
UL A OD B E E F F H - - P G 2017 M 2019 N 2018 0 2017 2019 2018 6268 3685 1324 949 3552 3113 713 366 246 193 12103 8306 20199 19691 198 68 339 282 393 422 1077 970 34309 29740 3368 515 2264 268 155 6571 20492 60 362 457 715 28655 55021 41250 30985 20540 16677 13164 20497 17174 16047 276.. 96334 75101 60197 97846 61797 48865 14754 14548 13350 4049 4110 3371 679 518 415 11586 6574 5111 225248 162648 131310 D 1 Company A 2 Assets (USD million) 3 cash and short term investment 4 accounts receivable, trade, net 5 total inventory 6 prepaid expenses 7 other current assets, total 8 total current assets 9 property/plant/equipment, total-net 10 goodwill, net 11 intangible, net 12 Note receivable-long term 13 other long term assets, total 14 Total asset 15 Liability 16 account payable 17 accrued expenses 18 current port of LT debucapital leases 19 other current liabilities, total 20 total current liablities 21 total long term debt 22 minority interest 23 other liablitities, total 24 total liabilities 25 Shareholder 26 common stock, total 27 additional paid-in-capital 28 retained earnings (accuulated deficit) 29 Other equity 30 total equity 31 total liabilities and shareholder 32 33 3771 2091 1785 3020 10667 11634 1492 3898 27691 3404 1373 2568 2647 9992 9494 1390 4030 24816 2390 1325 897 3063 7675 9418 1395 5930 24418 K Company B Assets (USD million) cash and short term investment accounts receivable, trade, net total inventory other current assets, total total current assets property/plant/equipment, total-net goodwill, net intangible, net long-term investment other long term assets, total Total asset Liability account payable accrued expenses current port of LT debucapital leases other current liabilities, total total current liablities total long term debt Deferred income tax other liabilitities, total total liabilities Shareholder common stock, total additional paid-in-capital retained earnings (accuulated deficit) treasury stock-common unrealized gain lose) Other equity total equity total liabilities and shareholder 47183 38192 34616 3113214161 11949 1307 9502 6221 8190 6536 5097 87812 68391 57883 405093978737925 1490 990 34867 9431 6802 163188 119099103601 0 0 21389 12737 -6083 -36 10249 -5318 -8 9178 -4974 33 5 5 5 33658 26791 31220 19625 8636 -1837 -1837 -1837 -16 -896 -1035 -458 62060 43549 27709 225248 162648 131310 6618 4237 4923 29740 34309 28655 34 B C E F F G H H J K L M N O 2477 135 A C D 43 44 Company 45 total revenure 46 cost of revenue, total 47 gross profit 48 selling/general/admin, epenses, total 49 research and development 50 unusual expenses (income) 51 total operating expenses 52 opertaing income 53 interest expensess, net non-operating 54 interest/invest income-non-opertaing 55 interest inc. (exp) net non-operating, total 56 others, net 57 net income before tax 58 provision or income tat 59 net income after tax 60 miority interest 61 net income before extra items 62 total extraordinary items 63 net income 64 2019 2018 2017 24578 21451 11759 2050917419 9536 4069 4042 2222 2646 2834 1343 1460 1378 149 24647 21849 13391 -69 -388 -1632 -685 -663 -471 92 26 72 -593 -637 -399 -30 20 -178 -565 -1005 -2209 110 -775 -1063 -1518 -87 279 -862 -976 -1239 -723 -862 -976 -1961 Company B total revenure cost of revenue, total gross profit selling/general/admin, epenses, total research and development depreciation/amortization Other operating expenses, total total operating expenses opertaing income interest expensess, net non-operating interest/invest income-non-opertaing interest inc. (exp) net non-operating, total others, net net income before tax provision or income tat net income after tax equity in affiliates net income before extra items total extraordinary items net income 2019 2018 2017 280522 232887 177865 165536 139156 111934 114986 93731 65932 64313 5217735992 35931 28837 22620 565 475 365 -364 -179 - 152 265981 220466 173760 14541 12421 4106 -1600 -1417 -848 832 440 442 -768 -977 -406 203 -183 106 13976 11261 3806 2374 1354 1558 11602 9907 2248 -14 -4 11588 9916 2244 157 789 11588 10073 3033 58 -691 86 9 0 list UL A OD B E E F F H - - P G 2017 M 2019 N 2018 0 2017 2019 2018 6268 3685 1324 949 3552 3113 713 366 246 193 12103 8306 20199 19691 198 68 339 282 393 422 1077 970 34309 29740 3368 515 2264 268 155 6571 20492 60 362 457 715 28655 55021 41250 30985 20540 16677 13164 20497 17174 16047 276.. 96334 75101 60197 97846 61797 48865 14754 14548 13350 4049 4110 3371 679 518 415 11586 6574 5111 225248 162648 131310 D 1 Company A 2 Assets (USD million) 3 cash and short term investment 4 accounts receivable, trade, net 5 total inventory 6 prepaid expenses 7 other current assets, total 8 total current assets 9 property/plant/equipment, total-net 10 goodwill, net 11 intangible, net 12 Note receivable-long term 13 other long term assets, total 14 Total asset 15 Liability 16 account payable 17 accrued expenses 18 current port of LT debucapital leases 19 other current liabilities, total 20 total current liablities 21 total long term debt 22 minority interest 23 other liablitities, total 24 total liabilities 25 Shareholder 26 common stock, total 27 additional paid-in-capital 28 retained earnings (accuulated deficit) 29 Other equity 30 total equity 31 total liabilities and shareholder 32 33 3771 2091 1785 3020 10667 11634 1492 3898 27691 3404 1373 2568 2647 9992 9494 1390 4030 24816 2390 1325 897 3063 7675 9418 1395 5930 24418 K Company B Assets (USD million) cash and short term investment accounts receivable, trade, net total inventory other current assets, total total current assets property/plant/equipment, total-net goodwill, net intangible, net long-term investment other long term assets, total Total asset Liability account payable accrued expenses current port of LT debucapital leases other current liabilities, total total current liablities total long term debt Deferred income tax other liabilitities, total total liabilities Shareholder common stock, total additional paid-in-capital retained earnings (accuulated deficit) treasury stock-common unrealized gain lose) Other equity total equity total liabilities and shareholder 47183 38192 34616 3113214161 11949 1307 9502 6221 8190 6536 5097 87812 68391 57883 405093978737925 1490 990 34867 9431 6802 163188 119099103601 0 0 21389 12737 -6083 -36 10249 -5318 -8 9178 -4974 33 5 5 5 33658 26791 31220 19625 8636 -1837 -1837 -1837 -16 -896 -1035 -458 62060 43549 27709 225248 162648 131310 6618 4237 4923 29740 34309 28655 34 B C E F F G H H J K L M N O 2477 135 A C D 43 44 Company 45 total revenure 46 cost of revenue, total 47 gross profit 48 selling/general/admin, epenses, total 49 research and development 50 unusual expenses (income) 51 total operating expenses 52 opertaing income 53 interest expensess, net non-operating 54 interest/invest income-non-opertaing 55 interest inc. (exp) net non-operating, total 56 others, net 57 net income before tax 58 provision or income tat 59 net income after tax 60 miority interest 61 net income before extra items 62 total extraordinary items 63 net income 64 2019 2018 2017 24578 21451 11759 2050917419 9536 4069 4042 2222 2646 2834 1343 1460 1378 149 24647 21849 13391 -69 -388 -1632 -685 -663 -471 92 26 72 -593 -637 -399 -30 20 -178 -565 -1005 -2209 110 -775 -1063 -1518 -87 279 -862 -976 -1239 -723 -862 -976 -1961 Company B total revenure cost of revenue, total gross profit selling/general/admin, epenses, total research and development depreciation/amortization Other operating expenses, total total operating expenses opertaing income interest expensess, net non-operating interest/invest income-non-opertaing interest inc. (exp) net non-operating, total others, net net income before tax provision or income tat net income after tax equity in affiliates net income before extra items total extraordinary items net income 2019 2018 2017 280522 232887 177865 165536 139156 111934 114986 93731 65932 64313 5217735992 35931 28837 22620 565 475 365 -364 -179 - 152 265981 220466 173760 14541 12421 4106 -1600 -1417 -848 832 440 442 -768 -977 -406 203 -183 106 13976 11261 3806 2374 1354 1558 11602 9907 2248 -14 -4 11588 9916 2244 157 789 11588 10073 3033 58 -691 86 9 0 listStep by Step Solution
There are 3 Steps involved in it
Step: 1

Get Instant Access to Expert-Tailored Solutions
See step-by-step solutions with expert insights and AI powered tools for academic success
Step: 2

Step: 3
Ace Your Homework with AI
Get the answers you need in no time with our AI-driven, step-by-step assistance
Get Started
Auditing The Procurement Function The Iia Research Foundation Handbook Series
Authors: David O Regan, CIA, FCA
1st Edition
0894136224, 978-0894136221