

Answered step by step
Verified Expert Solution
Question
1 Approved Answer
business analytics The following data are for 30 observations involving two categorical variables, x and y. The categories for x are A, B, and C;
business analytics 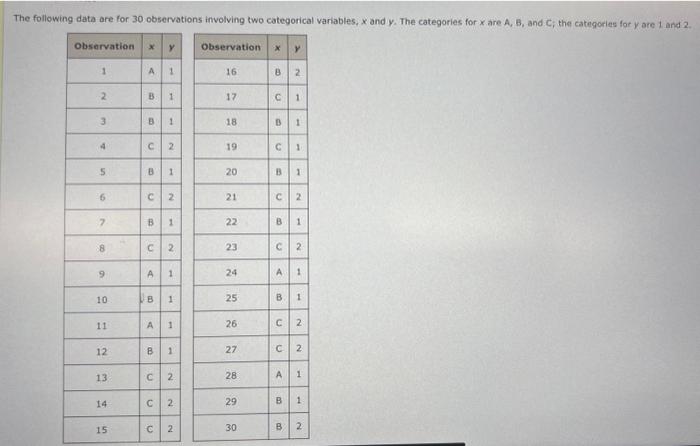

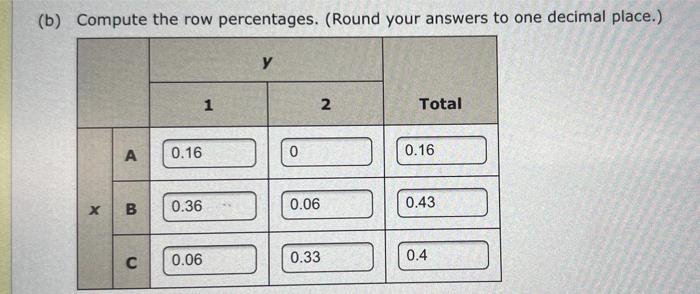
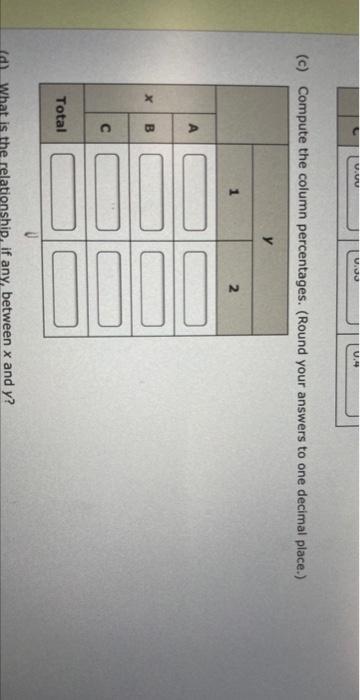
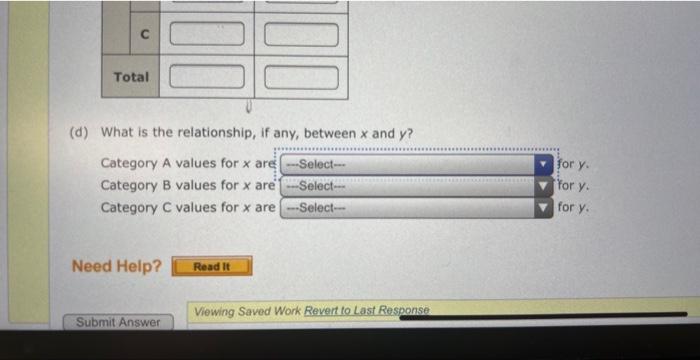
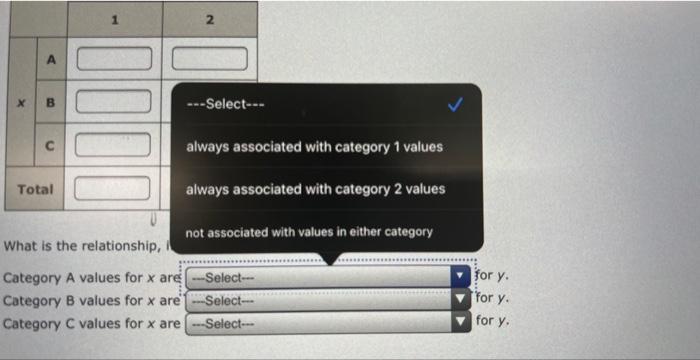
The following data are for 30 observations involving two categorical variables, x and y. The categories for x are A, B, and C; the categories for y are 1 and 2. (a) Develop a crosstabulation for the data, with x as the row variable and y as the column variable. (b) Compute the row percentages. (Round your answers to one decimal place.) (c) Compute the column percentages. (Round your answers to one decimal place.) (d) What is the relationship, if any, between x and y ? (d) What is the relationship, if any, between x and y ? Category A values for x are Category B values for x are Category C values for x are for y. for y. for y. What is the relationship, Category A values for x are Category B values for x are Category C values for x are Step by Step Solution
There are 3 Steps involved in it
Step: 1

Get Instant Access to Expert-Tailored Solutions
See step-by-step solutions with expert insights and AI powered tools for academic success
Step: 2

Step: 3
Ace Your Homework with AI
Get the answers you need in no time with our AI-driven, step-by-step assistance
Get Started
Pro Oracle Fusion Applications Installation And Administration
Authors: Tushar Thakker
1st Edition
1484209834, 9781484209837