Question
(C programming using codeblocks) For the following problem simply describe how software can be used to solve the problem and provide the input for the
(C programming using codeblocks) For the following problem simply describe how software can be used to solve the problem and provide the input for the software (user provided information) and the output of the software (how results are presented to the user). Please make sure to provide well subdivided logical subsections (about 3-4 subsections and a section for input/output) to give the background information required to solve the problem. The input/output section provides a clear description of what information is provided by the user and what output the software presents.

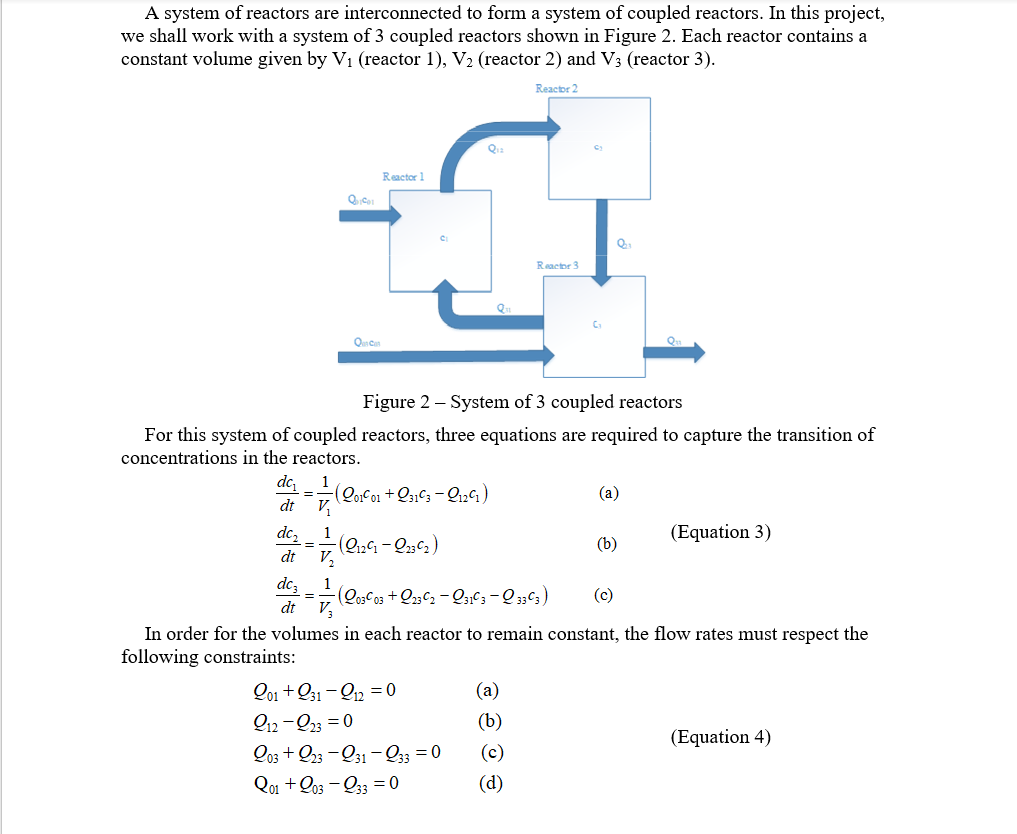
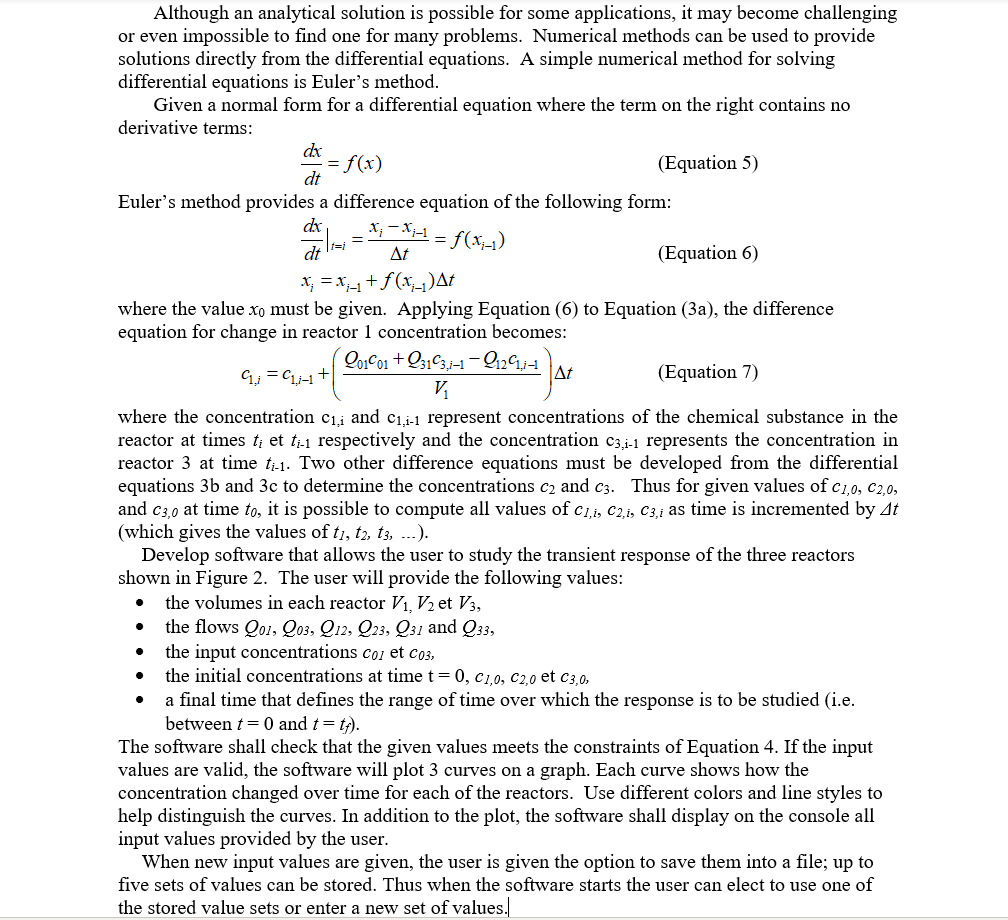
A system of reactors are interconnected to form a system of coupled reactors. In this project, we shall work with a system of 3 coupled reactors shown in Figure 2. Each reactor contains a constant volume given by Vi (reactor 1), V2 (reactor 2) and V3 (reactor 3) Reactor 2 Reactor 1 Con CI Reactor 3 Figure 2 - System of 3 coupled reactors For this system of coupled reactors, three equations are required to capture the transition of concentrations in the reactors (b)(Equation 3) dt V. dt In order for the volumes in each reactor to remain constant, the flow rates must respect the following constraints 912-023-(0 o3 923-31 9330 (c) (Equation 4) hough an analytical solution is possible for some applications, it may become challenging or even impossible to find one for many problems. Numerical methods can be used to provide solutions directly from the differential equations. A simple numerical method for solving differential equations is Euler's method Given a normal form for a differential equation where the term on the right contains no derivative terms: dr (Equation 5) Euler's method provides a difference equation of the following form dx dt At (Equation 6) where the value xo must be given. Applying Equation (6) to Equation (3a), the difference equation for change in reactor 1 concentration becomes At (Equation 7) V. where the concentration ci,i and c represent concentrations of the chemical substance in the reactor at times t et ti respectively and the concentration c3.i-1 represents the concentration in reactor 3 at time t1. Two other difference equations must be developed from the differential equations 3b and 3c to determine the concentrations c2 and c3. Thus for given values of c1,0, 2,0, and C3,0 at time to, it is possible to compute all values of c1,i, C2,i, C3,i as time is incremented by t (which gives the values of t, t2, t3, ...) Develop software that allows the user to study the transient response of the three reactors shown in Figure 2. The user will provide the following values the volumes in each reactor V. et V . the flows Qoi, L03, 012, 023, Q31 and Q33, * the input concentrations co et co3 the initial concentrations at time t-0, C1,0, c2,0 et c3,0. * * a final time that defines the range of time over which the response is to be studied (i.e betweent 0 and t-t The software shall check that the given values meets the constraints of Equation 4. If the input values are valid, the software will plot 3 curves on a graph. Each curve shows how the concentration changed over time for each of the reactors. Use different colors and line styles to help distinguish the curves. In addition to the plot, the software shall display on the console all input values provided by the user When new input values are given, the user is given the option to save them into a file; up to five sets of values can be stored. Thus when the software starts the user can elect to use one of the stored value sets or enter a new set of values A system of reactors are interconnected to form a system of coupled reactors. In this project, we shall work with a system of 3 coupled reactors shown in Figure 2. Each reactor contains a constant volume given by Vi (reactor 1), V2 (reactor 2) and V3 (reactor 3) Reactor 2 Reactor 1 Con CI Reactor 3 Figure 2 - System of 3 coupled reactors For this system of coupled reactors, three equations are required to capture the transition of concentrations in the reactors (b)(Equation 3) dt V. dt In order for the volumes in each reactor to remain constant, the flow rates must respect the following constraints 912-023-(0 o3 923-31 9330 (c) (Equation 4) hough an analytical solution is possible for some applications, it may become challenging or even impossible to find one for many problems. Numerical methods can be used to provide solutions directly from the differential equations. A simple numerical method for solving differential equations is Euler's method Given a normal form for a differential equation where the term on the right contains no derivative terms: dr (Equation 5) Euler's method provides a difference equation of the following form dx dt At (Equation 6) where the value xo must be given. Applying Equation (6) to Equation (3a), the difference equation for change in reactor 1 concentration becomes At (Equation 7) V. where the concentration ci,i and c represent concentrations of the chemical substance in the reactor at times t et ti respectively and the concentration c3.i-1 represents the concentration in reactor 3 at time t1. Two other difference equations must be developed from the differential equations 3b and 3c to determine the concentrations c2 and c3. Thus for given values of c1,0, 2,0, and C3,0 at time to, it is possible to compute all values of c1,i, C2,i, C3,i as time is incremented by t (which gives the values of t, t2, t3, ...) Develop software that allows the user to study the transient response of the three reactors shown in Figure 2. The user will provide the following values the volumes in each reactor V. et V . the flows Qoi, L03, 012, 023, Q31 and Q33, * the input concentrations co et co3 the initial concentrations at time t-0, C1,0, c2,0 et c3,0. * * a final time that defines the range of time over which the response is to be studied (i.e betweent 0 and t-t The software shall check that the given values meets the constraints of Equation 4. If the input values are valid, the software will plot 3 curves on a graph. Each curve shows how the concentration changed over time for each of the reactors. Use different colors and line styles to help distinguish the curves. In addition to the plot, the software shall display on the console all input values provided by the user When new input values are given, the user is given the option to save them into a file; up to five sets of values can be stored. Thus when the software starts the user can elect to use one of the stored value sets or enter a new set of values
Step by Step Solution
There are 3 Steps involved in it
Step: 1

Get Instant Access to Expert-Tailored Solutions
See step-by-step solutions with expert insights and AI powered tools for academic success
Step: 2

Step: 3

Ace Your Homework with AI
Get the answers you need in no time with our AI-driven, step-by-step assistance
Get Started


