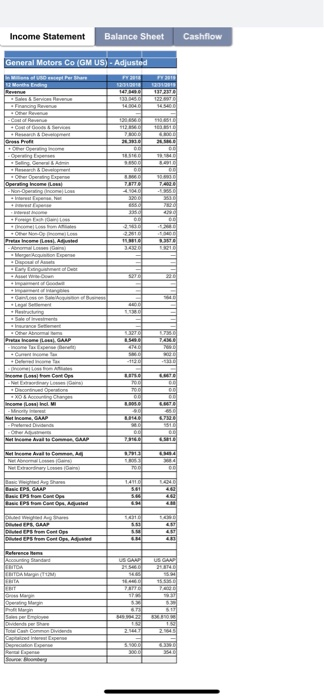
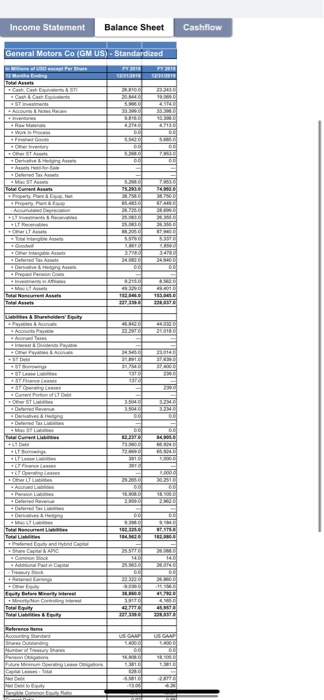
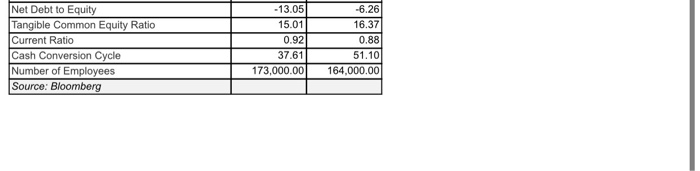
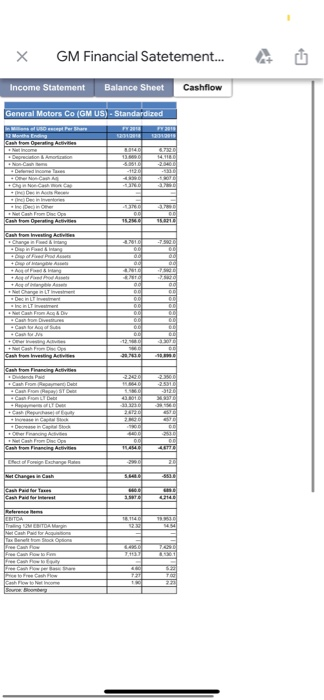
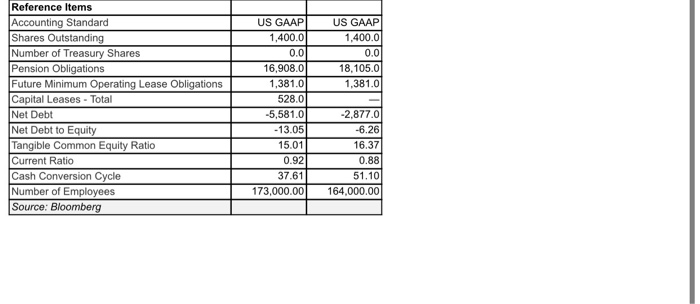
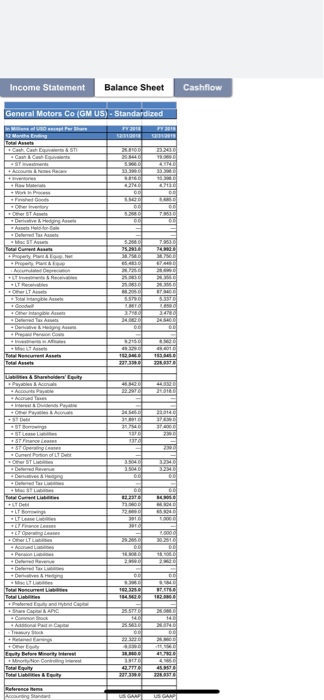
Calculate and interpret the two companies (Ford) and (GM) ratios (two years) Just the group of ratios mentioned in the grade center column. So you will upload your calculation and the interpretations, (Leverage Ratios)
this is the balance sheet for (gm uc)
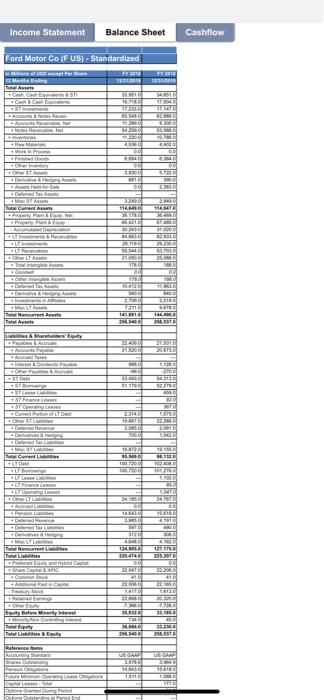
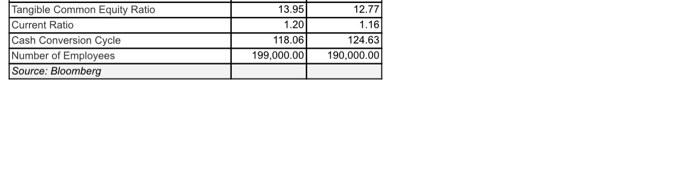
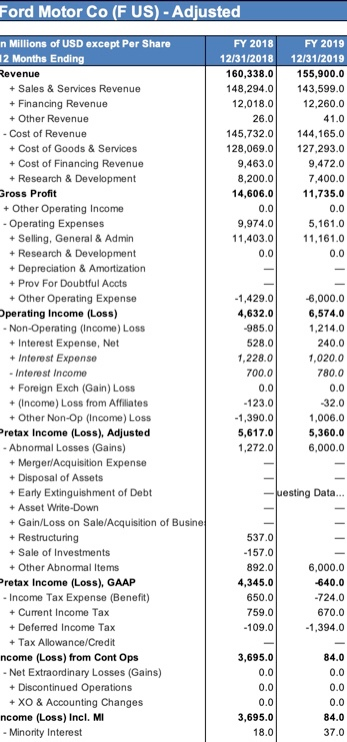
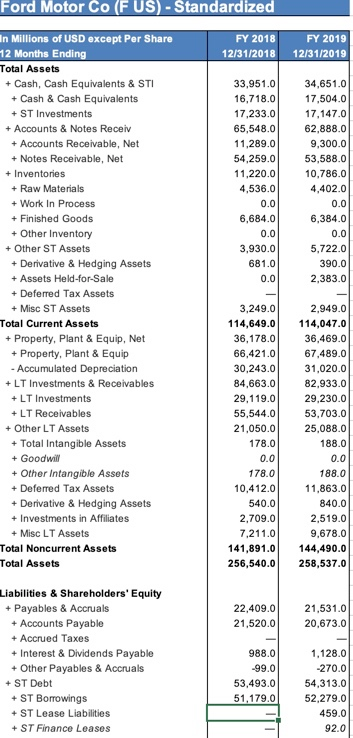
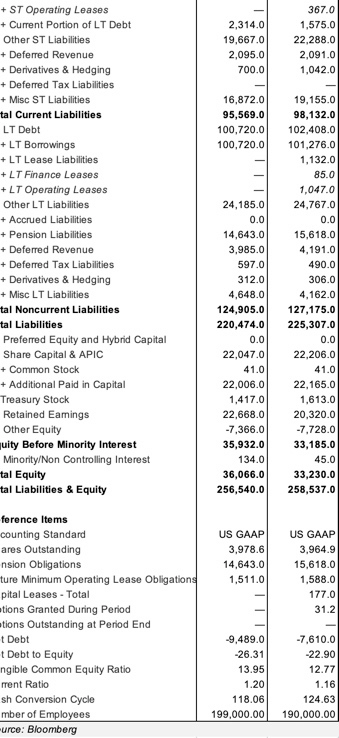
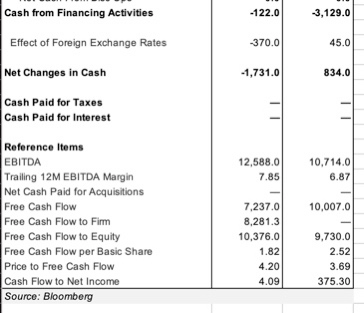
the balance sheet for ( F US)
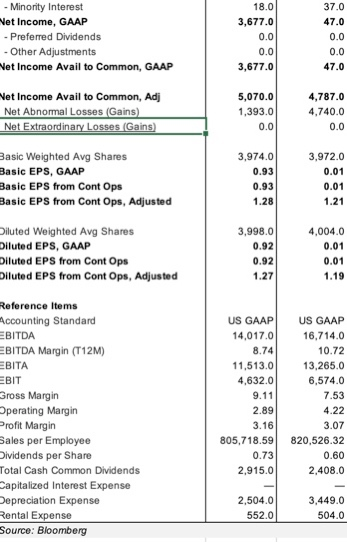
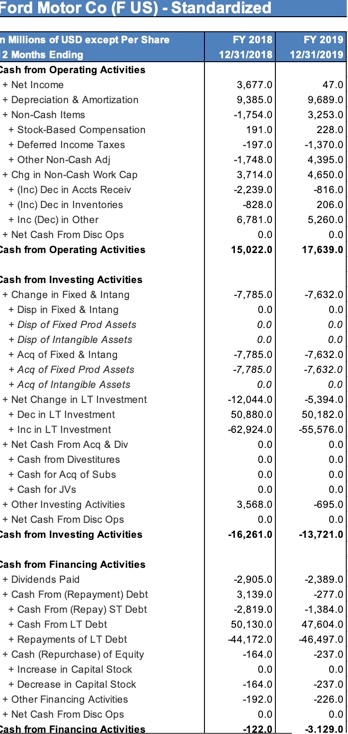
Ford Motor Co (F US) - Adjusted n Millions of USD except Per Share FY 2018 FY 2019 12 Months Ending 12/31/2018 12/31/2019 Revenue 160,338.0 155,900.0 Sales & Services Revenue 148,294.0 143,599.0 + Financing Revenue 12,018.0 12,260.0 + Other Revenue 26.0 41.0 - Cost of Revenue 145,732.0 144,165.0 + Cost of Goods & Services 128,069.0 127,293.0 + Cost of Financing Revenue 9,463.0 9,472.0 + Research & Development 8,200.0 7,400.0 Gross Profit 14,606.0 11,735.0 + Other Operating Income 0.0 0.0 - Operating Expenses 9,974.0 5,161.0 + Selling, General & Admin 11,403.0 11.161.0 + Research & Development 0.0 0.0 + Depreciation & Amortization + Prov For Doubtful Accts + Other Operating Expense -1,429.0 -6,000.0 Operating Income (Loss) 4,632.0 6,574.0 - Non-Operating (Income) Loss -985.0 1,214.0 + Interest Expense, Net 528.0 240.0 + Interest Expense 1,228.0 1,020.0 - Interest Income 700.0 780.0 + Foreign Exch (Gain) Loss 0.0 0.0 +(Income) Loss from Affiliates -123.0 -32.0 + Other Non-Op (Income) Loss -1,390.0 1,006.0 Pretax Income (Loss), Adjusted 5,617.0 5,360.0 - Abnormal Losses (Gains) 1,272.0 6,000.0 + Merger/Acquisition Expense + Disposal of Assets + Early Extinguishment of Debt uesting Data... Asset Write-Down + Gain/Loss on Sale/Acquisition of Busine + Restructuring 537.0 + Sale of Investments -157.01 + Other Abnormal Items 892.0 6,000.0 Pretax Income (Loss), GAAP 4,345.0 -640.0 - Income Tax Expense (Benefit) 650.0 -724.0 + Current Income Tax 759.0 670.0 + Deferred Income Tax -109.0 -1,394.0 + Tax Allowance/Credit ncome (Loss) from Cont Ops 3,695.0 84.0 -Net Extraordinary Losses (Gains) 0.0 0.0 + Discontinued Operations 0.0 0.0 + XO & Accounting Changes 0.0 0.0 ncome (Loss) Incl. MI 3,695.0 84.0 - Minority Interest 18.0 37.0 - Minority Interest Net Income, GAAP - Preferred Dividends - Other Adjustments Net Income Avail to Common, GAAP 18.01 3,677.0 0.0 0.0 3,677.0 37.0 47.0 0.0 0.0 47.0 5,070.0 1,393.0 0.0 4,787.0 4,740.0 0.0 Net Income Avail to Common, Adj Net Abnormal Losses (Gains) Net Extraordinary Losses (Gains) Basic Weighted Avg Shares Basic EPS, GAAP Basic EPS from Cont Ops Basic EPS from Cont Ops, Adjusted 3,974.0 0.93 0.93 1.28 3,972.0 0.01 0.01 1.21 Diluted Weighted Avg Shares Diluted EPS, GAAP Diluted EPS from Cont Ops Diluted EPS from Cont Ops, Adjusted 3,998.0 0.92 0.92 1.27 4,004.0 0.01 0.01 1.19 Reference Items Accounting Standard EBITDA EBITDA Margin (T12M) EBITA EBIT Gross Margin Operating Margin Profit Margin Sales per Employee Dividends per Share Total Cash Common Dividends Capitalized Interest Expense Depreciation Expense Rental Expense Source: Bloomberg US GAAP 14,017.0 8.74 11,513.0 4,632.0 9.11 2.89 3.16 805,718.59 0.73 2.915.0 US GAAP 16,714.0 10.72 13,265.0 6,574.0 7.53 4.22 3.07 820,526.32 0.60 2,408.0 2,504.0 552.0 3,449.0 504.0 FY 2019 12/31/2019 34,651.0 17,504.0 17,147.0 62,888.0 9,300.0 53,588.0 10,786.0 4,402.0 0.0 6,384.0 0.0 5,722.0 390.0 2,383.0 0.0 Ford Motor Co (F US) - Standardized In Millions of USD except Per Share FY 2018 12 Months Ending 12/31/2018 Total Assets + Cash, Cash Equivalents & STI 33,951.0 + Cash & Cash Equivalents 16,718.0 + ST Investments 17,233.0 + Accounts & Notes Receiv 65,548.0 + Accounts Receivable, Net 11,289.0 + Notes Receivable, Net 54,259.0 + Inventories 11,220.0 + Raw Materials 4,536.0 + Work In Process + Finished Goods 6,684.0 + Other Inventory 0.0 + Other ST Assets 3,930.0 + Derivative & Hedging Assets 681.0 + Assets Held-for-Sale 0.0 + Deferred Tax Assets + Misc ST Assets 3,249.0 Total Current Assets 114,649.0 + Property, Plant & Equip, Net 36,178.0 + Property, Plant & Equip 66,421.0 - Accumulated Depreciation 30,243.0 +LT Investments & Receivables 84.663.0 +LT Investments 29.119.0 + LT Receivables 55,544.0 + Other LT Assets 21.050.0 + Total Intangible Assets 178.0 + Goodwill + Other Intangible Assets 178.0 + Deferred Tax Assets 10,412.0 + Derivative & Hedging Assets 540.0 + Investments in Affiliates 2,709.0 + Misc LT Assets 7,211.0 Total Noncurrent Assets 141,891.0 Total Assets 256,540.0 2,949.0 114,047.0 36,469.0 67,489.0 31,020.0 82,933.0 29.230.0 53,703.0 25,088.0 188.0 0.0 188.0 11,863.0 840.0 2,519.0 9,678.0 144,490.0 258,537.0 0.0 22,409.0 21,520.0 21,531.0 20,673.0 Liabilities & Shareholders' Equity + Payables & Accruals + Accounts Payable + Accrued Taxes + Interest & Dividends Payable + Other Payables & Accruals + ST Debt + ST Borrowings + ST Lease Liabilities + ST Finance Leases 988.0 -99.0 53,493.0 51,179.0 1,128.0 -270.0 54,313.0 52,279.0 459.0 92.0 FY 2019 12/31/2019 Ford Motor Co (F US) - Standardized Millions of USD except Per Share FY 2018 2 Months Ending 12/31/2018 cash from Operating Activities + Net Income 3,677.0 + Depreciation & Amortization 9,385.0 + Non-Cash Items -1,754.0 + Stock-Based Compensation 191.0 + Deferred Income Taxes -197.0 + Other Non-Cash Adi -1,748.0 + Chg in Non-Cash Work Cap 3,714.0 + (Inc) Dec in Accts Receiv -2,239.0 + (Inc) Dec in Inventories -828.0 + Inc (Dec) in Other 6,781.0 + Net Cash From Disc Ops 0.0 cash from Operating Activities 15,022.0 47.0 9,689.0 3,253.0 228.0 -1,370.0 4,395.0 4,650.0 -816.0 206.0 5,260.0 0.0 17,639.0 cash from Investing Activities + Change in Fixed & Intang + Disp in Fixed & Intang + Disp of Fixed Prod Assets + Disp of Intangible Assets + Acq of Fixed & Intang + Acg of Fixed Prod Assets + Acq of Intangible Assets + Net Change in LT Investment + Dec in LT Investment + Inc in LT Investment + Net Cash From Acq & Div + Cash from Divestitures + Cash for Acq of Subs + Cash for JVs + Other Investing Activities + Net Cash From Disc Ops cash from Investing Activities -7,785.0 0.0 0.0 0.0 -7,785.0 -7.785.0 0.0 -12,044.0 50.880.0 -62,924.0 -7,632.0 0.0 0.0 0.0 -7,632.0 -7,632.0 0.0 5,394.0 50,182.0 -55,576.0 0.0 0.0 0.0 0.0 -695.0 0.0 -13,721.0 0.0 0.0 0.0 0.0 3,568.0 0.0 -16,261.0 cash from Financing Activities + Dividends Paid + Cash From (Repayment) Debt + Cash From (Repay) ST Debt + Cash From LT Debt + Repayments of LT Debt + Cash (Repurchase) of Equity + Increase in Capital Stock + Decrease in Capital Stock + Other Financing Activities + Net Cash From Disc Ops Cash from Financing Activities -2,905.0 3,139.0 -2,819.0 50,130.0 -44,172.0 -164.0 0.0 -164.0 -192.0 0.0 -122.0 -2,389.0 -277.0 -1,384.0 47.604.0 46,497.0 -237.0 0.0 -237.0 -226.0 0.0 3.129.0 2,314.0 19,667.0 2,095.0 700.0 367.0 1,575.0 22,288.0 2,091.0 1,042.0 16,872.0 95,569.0 100,720.0 100,720.0 + ST Operating Leases + Current Portion of LT Debt Other ST Liabilities + Deferred Revenue + Derivatives & Hedging + Deferred Tax Liabilities + Misc ST Liabilities tal Current Liabilities LT Debt +LT Borrowings + LT Lease Liabilities +LT Finance Leases +LT Operating Leases Other LT Liabilities + Accrued Liabilities + Pension Liabilities + Deferred Revenue + Deferred Tax Liabilities + Derivatives & Hedging + Misc LT Liabilities tal Noncurrent Liabilities tal Liabilities Preferred Equity and Hybrid Capital Share Capital & APIC + Common Stock + Additional Paid in Capital Treasury Stock Retained Eamings Other Equity muity Before Minority Interest Minority/Non Controlling Interest tal Equity tal Liabilities & Equity 24,185.0 0.0 14,643.0 3,985.0 597.0 312.0 4,648.0 124,905.0 220,474.0 0.0 22,047.0 41.0 22,006.0 1,417.0 22,668.0 -7.366.0 35,932.0 134.0 36,066.0 256,540.0 19,155.0 98,132.0 102,408.0 101,276.0 1,132.0 85.0 1,047.0 24,767.0 0.0 15,618.0 4,191.0 490.0 306.0 4,162.0 127,175.0 225,307.0 0.0 22,206.0 41.0 22,165.0 1,613.0 20,320.0 -7,728.0 33,185.0 45.0 33,230.0 258,537.0 US GAAP 3,978.6 14,643.0 1,511.0 US GAAP 3,964.9 15,618.0 1,588.0 177.0 312 ference Items counting Standard ares Outstanding nsion Obligations ture Minimum Operating Lease Obligations pital Leases - Total tions Granted During Period ations Outstanding at Period End t Debt t Debt to Equity ngible Common Equity Ratio rrent Ratio sh Conversion Cycle mber of Employees urce: Bloomberg -9,489.0 -26.31 13.95 1.20 118.06 199,000.00 -7.610.0 -22.90 12.77 1.16 124.63 190,000.00 Cash from Financing Activities -122.0 3,129.0 Effect of Foreign Exchange Rates 370.0 45.0 Net Changes in Cash -1,731.0 834.0 Cash Paid for Taxes Cash Paid for Interest 12,588.0 7.85 10.714.0 6.87 10.007.0 Reference Items EBITDA Trailing 12M EBITDA Margin Net Cash Paid for Acquisitions Free Cash Flow Free Cash Flow to Firm Free Cash Flow to Equity Free Cash Flow per Basic Share Price to Free Cash Flow Cash Flow to Net Income Source: Bloomberg 7.237.0 8,281.3 10,376.0 1.82 4.20 4.09 9,730.0 2.52 3.69 375.30 Income Statement Balance Sheet Cashflow General Motors Co (GM US) - Adjusted where FY2018 Rew Fron TOTE OP - Operating teen WTC Opening home income Porto BRIE OL Prince - Aromalam non Les DOPE ngushment 27 SE LAP income cap das Themention Contra Nerinary Care Decor Lone ELITE 00 TOEI OEI CATE LM - Since Nice Avail Com CAN TI ME Net Avail to C AG Aenende erordinary Loom Games Besar Base LPS GAAP 149 44 SI RE DEPOLA ed EPs from Condoms Dited EPS from Contr. Add 43 Reference TE Bevedo Common Dividende corned internet per 21 24 3 Income Statement Balance Sheet Cashflow General Motors Co (GMUS) - Standardized Toto Aset Cash Cash quo 85TI Cash Derta Asset Helstorale 00 Torrent 7. TA STE Bergleich Servere RI RE TE NE TE Toate Assets U & Shareholders' TE Les OSTERS Gure Pool LTO Over STE Dermed Derived Frog HE Cumenti BE f este = - France BOLT card To Libre Pored to distrid BE Before Minority interest 45 42 TTC 32730 TE Reference teme According Standard USCA Preu case and SI 28 Net Debt to Equity Tangible Common Equity Ratio Current Ratio Cash Conversion Cycle Number of Employees Source: Bloomberg -13.05 15.01 0.92 37.61 173,000.00 -6.26 16.37 0.88 51.10 164,000.00 GM Financial Satetement... Income Statement Balance Sheet Cashflow General Motors Co (GMUS) - Standardized FY2 Cash from Operating Activities erection Lorem came CA ON.Cam DAR De NEI 00 TI DE TE Cash from Operating Active Cash from mang vides - ad DE Dar Livestre Becher DE CASADY CE + CO SEI 30 Cashtromani Alves cho MEDE COOL - -De Co Net Cash From Doc Ope Cash from Financing Activities Ledor Lachange Nut Changes in con TI TE CORP 14 TE TRENTO NetCath Pastor honom Pue lo reca Show to come Sure Boom Income Statement Balance Sheet Cashflow General Motors Co (GMUS) - Standardized FY2 TA Cash Cash 557 RE ALOR CE edot Dermed Id Ant ELE lum 2016 Recettes OLTA 3.72 GE TE 22 TA UL cony ALS RE DET . BE Our Portion / LTE Om STUMS TI TMC - De LTL Finance TOGLOSBE 2000 TERE TE RE RE dan 37. 162 Totul antren ToLib med Loadinya CARO And Equity Before Minority interest Minor No Contingent EI TI 427 2073 45 22 Total Seferences US US GAAP 1,400.0 0.0 18,105.0 1,381.0 Reference Items Accounting Standard Shares Outstanding Number of Treasury Shares Pension Obligations Future Minimum Operating Lease Obligations Capital Leases - Total Net Debt Net Debt to Equity Tangible Common Equity Ratio Current Ratio Cash Conversion Cycle Number of Employees Source: Bloomberg US GAAP 1,400.0 0.0 16,908.0 1,381.0 528.0 -5,581.0 -13.05 15.01 0.92 37.61 173,000.00 -2,877.0 -6.26 16.37 0.88 51.10 164,000.00 Income Statement Balance Sheet Cashflow Ford Motor Co (F US) - Standardized Mans Ferrar TA Cash Cash over 85 C Cash Svement SET NH verones SE er ST A Derive pledging 2 Der Text TIME TE Alder Tere 351 TE Toontresses TART & Bar Dec MEI We Play Credo BAR SETEL +STFLOSS STOL Currency DOSTUME Berlerden RE TE THE med 1000 100 LT LL TEL Dommerce BRE dames MUL Tot Nancurrent 3701 4 134 LE ord Euty Before Minority interest TE Totes 2010 25 trene UGAN U STE Join Oud med Tangible Common Equity Ratio Current Ratio Cash Conversion Cycle Number of Employees Source: Bloomberg 13.95 1.20 118.06 199,000.00 12.77 1.16 124.63 190,000.00