

Question
Calculate and submit the required financial ratios related to the Fortune 500 company you selected in Week 1 (Walmart); this will be based on the
Calculate and submit the required financial ratios related to the Fortune 500 company you selected in Week 1 (Walmart); this will be based on the past three years of your firms balance sheets and income statements.
 I don't know what other information you would need, because that is what I received from the Professor regarding the question.
UPDATE: My professor informed me that there needs to be calculations done on the financial ratios.
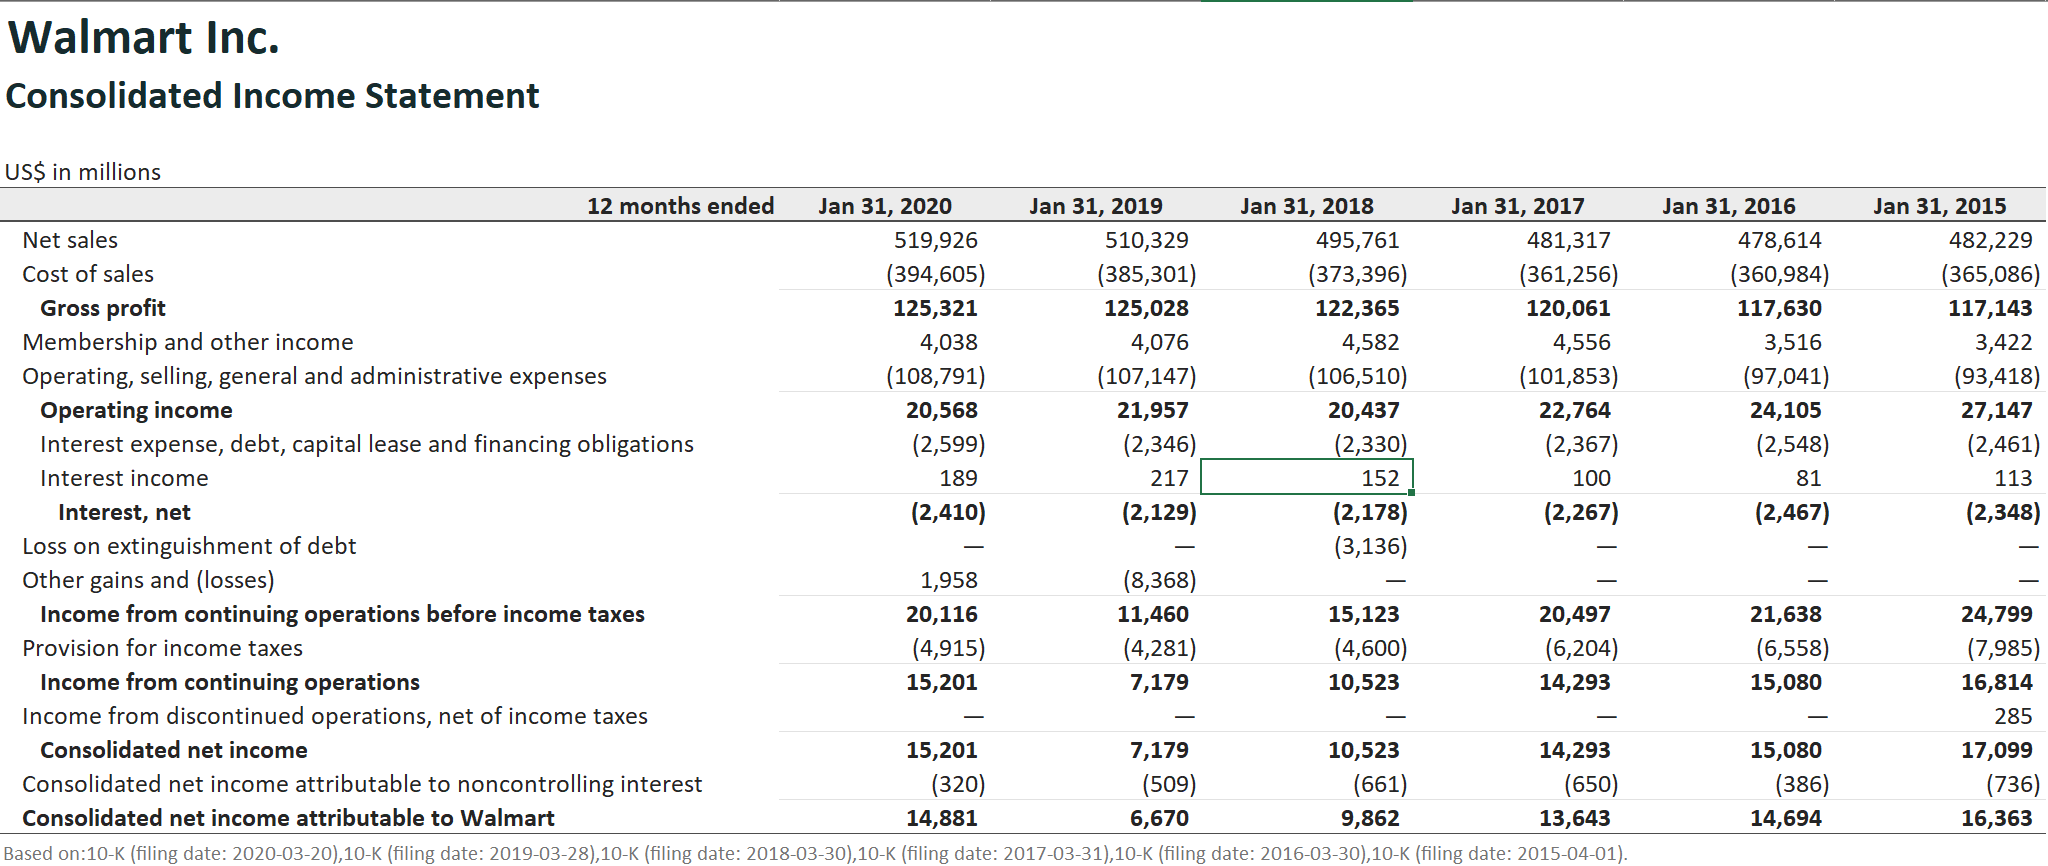
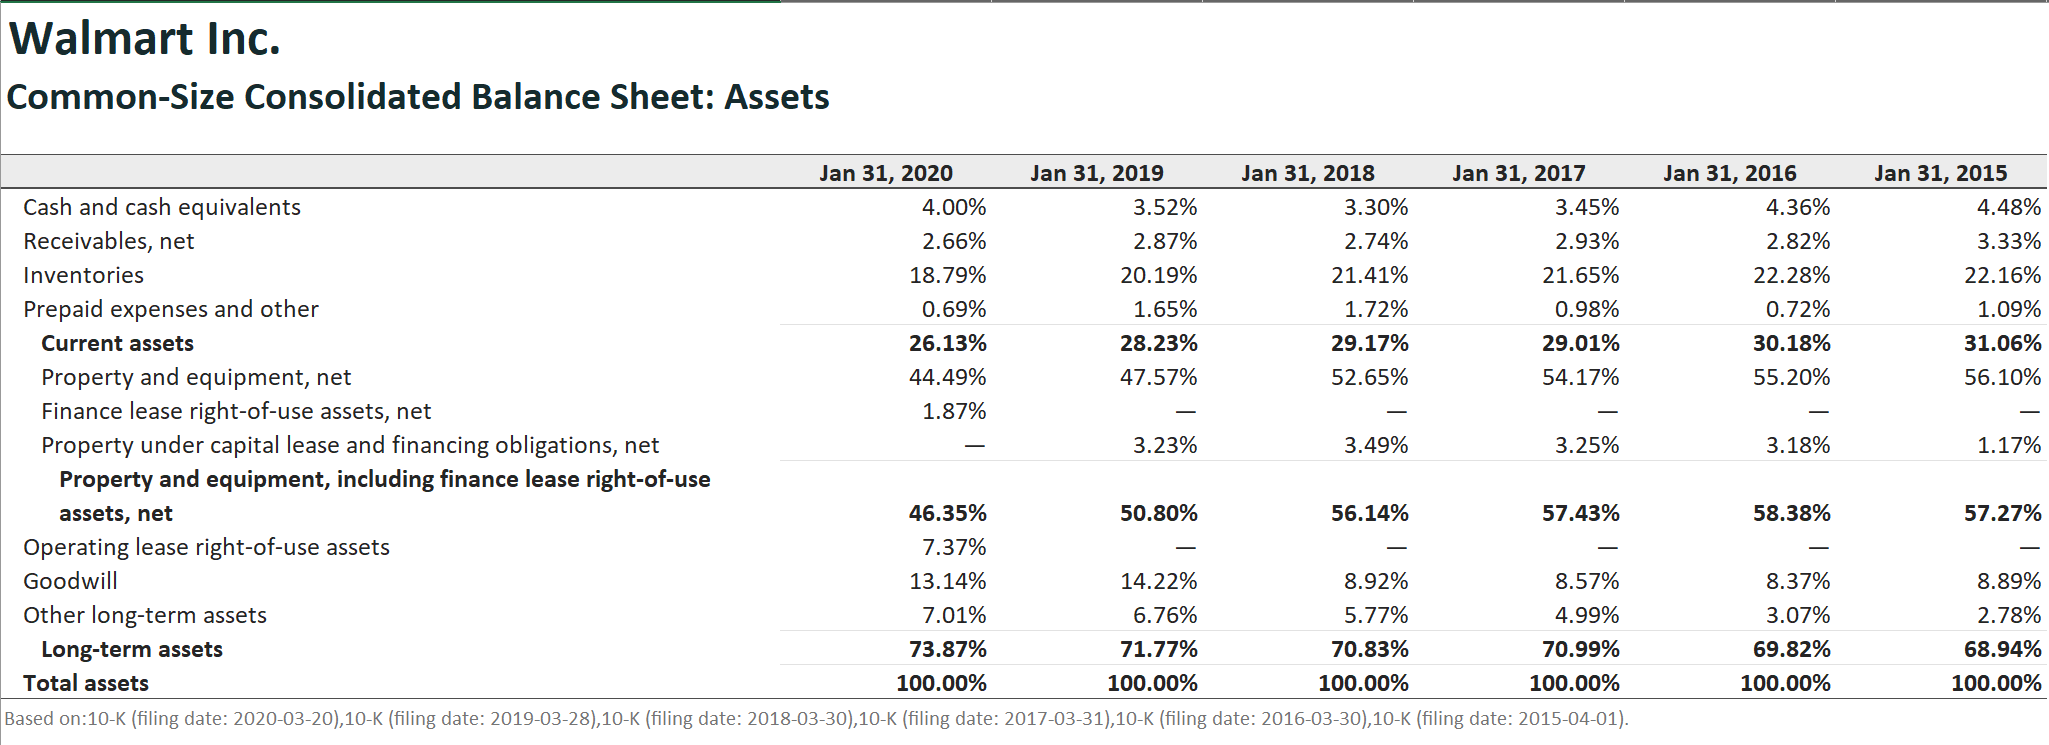
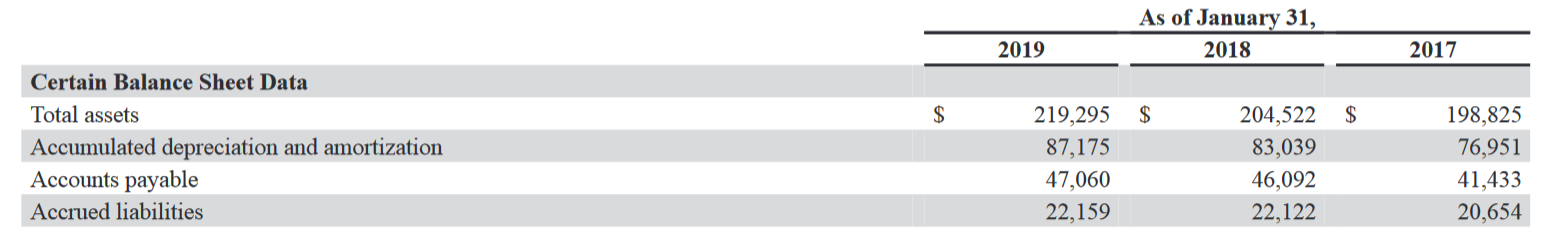
Walmart Inc. Consolidated Income Statement US$ in millions 12 months ended Jan 31, 2020 Jan 31, 2019 Jan 31, 2018 Jan 31, 2017 Net sales 519,926 510,329 495,761 481,317 Cost of sales (394,605) (385,301) (373,396) (361,256) Gross profit 125,321 125,028 122,365 120,061 Membership and other income 4,038 4,076 4,582 4,556 Operating, selling, general and administrative expenses (108,791) (107,147) (106,510) (101,853) Operating income 20,568 21,957 20,437 22,764 Interest expense, debt, capital lease and financing obligations (2,599) (2,346) (2,330) (2,367) Interest income 189 217 152 100 Interest, net (2,410) (2,129) (2,178) (2,267) Loss on extinguishment of debt (3,136) Other gains and (losses) 1,958 (8,368) Income from continuing operations before income taxes 20,116 11,460 15,123 20,497 Provision for income taxes (4,915) (4,281) (4,600) (6,204) Income from continuing operations 15,201 7,179 10,523 14,293 Income from discontinued operations, net of income taxes Consolidated net income 15,201 7,179 10,523 14,293 Consolidated net income attributable to noncontrolling interest (320) (509) (661) (650) Consolidated net income attributable to Walmart 14,881 6,670 9,862 13,643 Based on:10-K (filing date: 2020-03-20),10-K (filing date: 2019-03-28),10-K (filing date: 2018-03-30),10-K (filing date: 2017-03-31),10-K (filing date: 2016-03-30),10-K (filing date: 2015-04-01). Jan 31, 2016 478,614 (360,984) 117,630 3,516 (97,041) 24,105 (2,548) 81 (2,467) Jan 31, 2015 482,229 (365,086) 117,143 3,422 (93,418) 27,147 (2,461) 113 (2,348) 21,638 (6,558) 15,080 24,799 (7,985) 16,814 285 17,099 (736) 16,363 15,080 (386) 14,694 Walmart Inc. Common-Size Consolidated Balance Sheet: Assets Jan 31, 2016 4.36% 2.82% 22.28% 0.72% 30.18% 55.20% Jan 31, 2015 4.48% 3.33% 22.16% 1.09% 31.06% 56.10% Jan 31, 2020 Jan 31, 2019 Jan 31, 2018 Jan 31, 2017 Cash and cash equivalents 4.00% 3.52% 3.30% 3.45% Receivables, net 2.66% 2.87% 2.74% 2.93% Inventories 18.79% 20.19% 21.41% 21.65% Prepaid expenses and other 0.69% 1.65% 1.72% 0.98% Current assets 26.13% 28.23% 29.17% 29.01% Property and equipment, net 44.49% 47.57% 52.65% 54.17% Finance lease right-of-use assets, net 1.87% Property under capital lease and financing obligations, net 3.23% 3.49% 3.25% Property and equipment, including finance lease right-of-use assets, net 46.35% 50.80% 56.14% 57.43% Operating lease right-of-use assets 7.37% Goodwill 13.14% 14.22% 8.92% 8.57% Other long-term assets 7.01% 6.76% 5.77% 4.99% Long-term assets 73.87% 71.77% 70.83% 70.99% Total assets 100.00% 100.00% 100.00% 100.00% Based on:10-K (filing date: 2020-03-20),10-K (filing date: 2019-03-28),10-K (filing date: 2018-03-30),10-K (filing date: 2017-03-31),10-K (filing date: 2016-03-30),10-K (filing date: 2015-04-01). 3.18% 1.17% 58.38% 57.27% 8.37% 3.07% 69.82% 100.00% 8.89% 2.78% 68.94% 100.00% As of January 31, 2018 2019 2017 $ $ Certain Balance Sheet Data Total assets Accumulated depreciation and amortization Accounts payable Accrued liabilities 219,295 87,175 47,060 22,159 204,522 $ 83,039 46,092 22,122 198,825 76,951 41,433 20,654 Walmart Inc. Consolidated Income Statement US$ in millions 12 months ended Jan 31, 2020 Jan 31, 2019 Jan 31, 2018 Jan 31, 2017 Net sales 519,926 510,329 495,761 481,317 Cost of sales (394,605) (385,301) (373,396) (361,256) Gross profit 125,321 125,028 122,365 120,061 Membership and other income 4,038 4,076 4,582 4,556 Operating, selling, general and administrative expenses (108,791) (107,147) (106,510) (101,853) Operating income 20,568 21,957 20,437 22,764 Interest expense, debt, capital lease and financing obligations (2,599) (2,346) (2,330) (2,367) Interest income 189 217 152 100 Interest, net (2,410) (2,129) (2,178) (2,267) Loss on extinguishment of debt (3,136) Other gains and (losses) 1,958 (8,368) Income from continuing operations before income taxes 20,116 11,460 15,123 20,497 Provision for income taxes (4,915) (4,281) (4,600) (6,204) Income from continuing operations 15,201 7,179 10,523 14,293 Income from discontinued operations, net of income taxes Consolidated net income 15,201 7,179 10,523 14,293 Consolidated net income attributable to noncontrolling interest (320) (509) (661) (650) Consolidated net income attributable to Walmart 14,881 6,670 9,862 13,643 Based on:10-K (filing date: 2020-03-20),10-K (filing date: 2019-03-28),10-K (filing date: 2018-03-30),10-K (filing date: 2017-03-31),10-K (filing date: 2016-03-30),10-K (filing date: 2015-04-01). Jan 31, 2016 478,614 (360,984) 117,630 3,516 (97,041) 24,105 (2,548) 81 (2,467) Jan 31, 2015 482,229 (365,086) 117,143 3,422 (93,418) 27,147 (2,461) 113 (2,348) 21,638 (6,558) 15,080 24,799 (7,985) 16,814 285 17,099 (736) 16,363 15,080 (386) 14,694 Walmart Inc. Common-Size Consolidated Balance Sheet: Assets Jan 31, 2016 4.36% 2.82% 22.28% 0.72% 30.18% 55.20% Jan 31, 2015 4.48% 3.33% 22.16% 1.09% 31.06% 56.10% Jan 31, 2020 Jan 31, 2019 Jan 31, 2018 Jan 31, 2017 Cash and cash equivalents 4.00% 3.52% 3.30% 3.45% Receivables, net 2.66% 2.87% 2.74% 2.93% Inventories 18.79% 20.19% 21.41% 21.65% Prepaid expenses and other 0.69% 1.65% 1.72% 0.98% Current assets 26.13% 28.23% 29.17% 29.01% Property and equipment, net 44.49% 47.57% 52.65% 54.17% Finance lease right-of-use assets, net 1.87% Property under capital lease and financing obligations, net 3.23% 3.49% 3.25% Property and equipment, including finance lease right-of-use assets, net 46.35% 50.80% 56.14% 57.43% Operating lease right-of-use assets 7.37% Goodwill 13.14% 14.22% 8.92% 8.57% Other long-term assets 7.01% 6.76% 5.77% 4.99% Long-term assets 73.87% 71.77% 70.83% 70.99% Total assets 100.00% 100.00% 100.00% 100.00% Based on:10-K (filing date: 2020-03-20),10-K (filing date: 2019-03-28),10-K (filing date: 2018-03-30),10-K (filing date: 2017-03-31),10-K (filing date: 2016-03-30),10-K (filing date: 2015-04-01). 3.18% 1.17% 58.38% 57.27% 8.37% 3.07% 69.82% 100.00% 8.89% 2.78% 68.94% 100.00% As of January 31, 2018 2019 2017 $ $ Certain Balance Sheet Data Total assets Accumulated depreciation and amortization Accounts payable Accrued liabilities 219,295 87,175 47,060 22,159 204,522 $ 83,039 46,092 22,122 198,825 76,951 41,433 20,654Step by Step Solution
There are 3 Steps involved in it
Step: 1

Get Instant Access to Expert-Tailored Solutions
See step-by-step solutions with expert insights and AI powered tools for academic success
Step: 2

Step: 3
Ace Your Homework with AI
Get the answers you need in no time with our AI-driven, step-by-step assistance
Get Started
Options Trading 12 Books In 1 Elevate Your Profits Erase Risks The Definitive Guide From Rookie To Top 1 Trader
Authors: Warren Ray Benjamin
1st Edition
979-8860106413