Answered step by step
Verified Expert Solution
Question
1 Approved Answer
Calculate Current Ratio Quick Ratio What do each tell you about the company's financial situation? Assume that you have a company with this Balance Sheet:
Calculate
- Current Ratio
- Quick Ratio
- What do each tell you about the company's financial situation?
Assume that you have a company with this Balance Sheet:
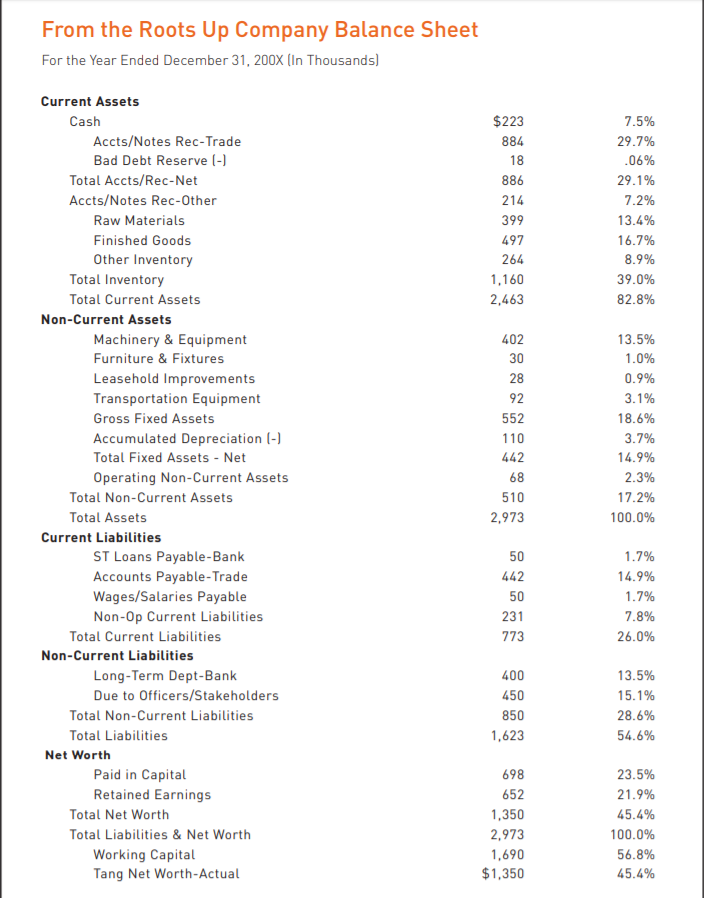
From the Roots Up Company Balance Sheet For the Year Ended December 31, 200X (In Thousands) $223 884 18 886 214 399 497 264 1,160 2,463 7.5% 29.7% .06% 29.1% 7.2% 13.4% 16.7% 8.9% 39.0% 82.8% 402 30 28 92 552 110 442 68 Current Assets Cash Accts/Notes Rec-Trade Bad Debt Reserve (-) Total Accts/Rec-Net Accts/Notes Rec-Other Raw Materials Finished Goods Other Inventory Total Inventory Total Current Assets Non-Current Assets Machinery & Equipment Furniture & Fixtures Leasehold Improvements Transportation Equipment Gross Fixed Assets Accumulated Depreciation (-) Total Fixed Assets - Net Operating Non-Current Assets Total Non-Current Assets Total Assets Current Liabilities ST Loans Payable-Bank Accounts Payable-Trade Wages/Salaries Payable Non-Op Current Liabilities Total Current Liabilities Non-Current Liabilities Long-Term Dept-Bank Due to Officers/Stakeholders Total Non-Current Liabilities Total Liabilities Net Worth Paid in Capital Retained Earnings Total Net Worth Total Liabilities & Net Worth Working Capital Tang Net Worth-Actual 13.5% 1.0% 0.9% 3.1% 18.6% 3.7% 14.9% 2.3% 17.2% 100.0% 510 2,973 50 442 50 231 773 1.7% 14.9% 1.7% 7.8% 26.0% 400 450 13.5% 15.1% 28.6% 54.6% 850 1,623 698 652 1,350 2,973 1,690 $1,350 23.5% 21.9% 45.4% 100.0% 56.8% 45.4%Step by Step Solution
There are 3 Steps involved in it
Step: 1
Get Instant Access to Expert-Tailored Solutions
See step-by-step solutions with expert insights and AI powered tools for academic success
Step: 2
Step: 3
Ace Your Homework with AI
Get the answers you need in no time with our AI-driven, step-by-step assistance
Get Started