

Answered step by step
Verified Expert Solution
Question
1 Approved Answer
Calculate Earnings Per Share using the following formula and information: (Net Inclme - Preffered Dividends) / Weighted Average Number of Common Shares Outstanding 2013 XYZ
Calculate Earnings Per Share using the following formula and information: 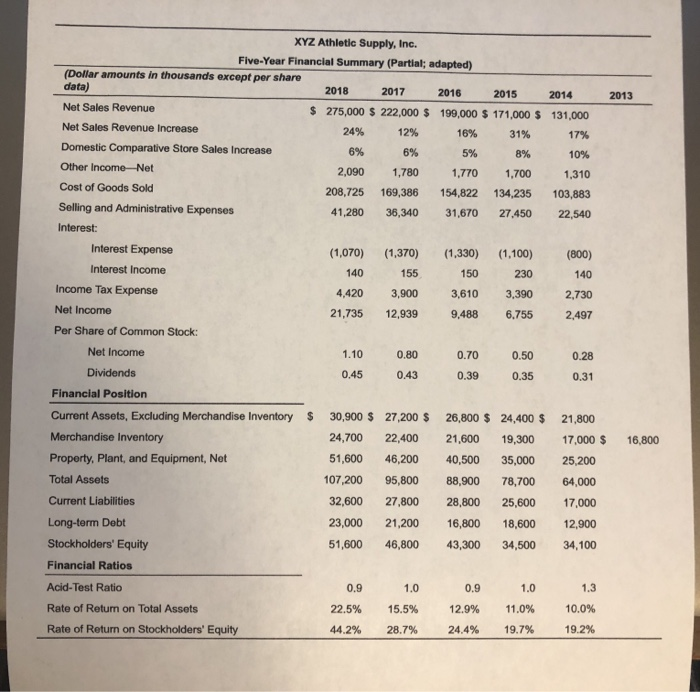
2013 XYZ Athletic Supply, Inc. Five-Year Financial Summary (Partial; adapted) (Dollar amounts in thousands except per share data) 2018 2017 2016 2015 Net Sales Revenue $ 275,000 $ 222,000 $ 199,000 $ 171,000 $ Net Sales Revenue Increase 24% 12% 16% 31% Domestic Comparative Store Sales Increase 6% 6% 5% 8% Other Income-Net 2,090 1,780 1,770 1,700 Cost of Goods Sold 208,725 169,386 154,822 134,235 Selling and Administrative Expenses 41,280 36,340 31,670 27,450 2014 131,000 17% 10% 1,310 103,883 22,540 Interest: Interest Expense (1,070) 140 4,420 21,735 (1,370) 155 3,900 12,939 (1,330) 150 3,610 9.488 (1,100) 230 3,390 6.755 (800) 140 2,730 2,497 1.10 0.45 0.80 0.43 0.70 0.39 0.50 0.35 0.28 0.31 $ 16,800 Interest Income Income Tax Expense Net Income Per Share of Common Stock: Net Income Dividends Financial Position Current Assets, Excluding Merchandise Inventory Merchandise Inventory Property, Plant, and Equipment, Net Total Assets Current Liabilities Long-term Debt Stockholders' Equity Financial Ratios Acid-Test Ratio Rate of Retum on Total Assets Rate of Return on Stockholders' Equity 30,900 $ 24,700 51,600 107,200 32,600 23,000 51,600 27,200 $ 22,400 46,200 95,800 27,800 21,200 46,800 26,800 $ 21,600 40,500 88,900 28,800 16,800 43,300 24,400 $ 19,300 35,000 78,700 25,600 18,600 34,500 21,800 17,000 $ 25,200 64,000 17,000 12,900 34,100 0.9 22.5% 44.2% 1.0 15.5% 28.7% 0.9 12.9% 24.4% 1.0 11.0% 19.7% 1.3 0.0% 19.2% 2013 XYZ Athletic Supply, Inc. Five-Year Financial Summary (Partial; adapted) (Dollar amounts in thousands except per share data) 2018 2017 2016 2015 Net Sales Revenue $ 275,000 $ 222,000 $ 199,000 $ 171,000 $ Net Sales Revenue Increase 24% 12% 16% 31% Domestic Comparative Store Sales Increase 6% 6% 5% 8% Other Income-Net 2,090 1,780 1,770 1,700 Cost of Goods Sold 208,725 169,386 154,822 134,235 Selling and Administrative Expenses 41,280 36,340 31,670 27,450 2014 131,000 17% 10% 1,310 103,883 22,540 Interest: Interest Expense (1,070) 140 4,420 21,735 (1,370) 155 3,900 12,939 (1,330) 150 3,610 9.488 (1,100) 230 3,390 6.755 (800) 140 2,730 2,497 1.10 0.45 0.80 0.43 0.70 0.39 0.50 0.35 0.28 0.31 $ 16,800 Interest Income Income Tax Expense Net Income Per Share of Common Stock: Net Income Dividends Financial Position Current Assets, Excluding Merchandise Inventory Merchandise Inventory Property, Plant, and Equipment, Net Total Assets Current Liabilities Long-term Debt Stockholders' Equity Financial Ratios Acid-Test Ratio Rate of Retum on Total Assets Rate of Return on Stockholders' Equity 30,900 $ 24,700 51,600 107,200 32,600 23,000 51,600 27,200 $ 22,400 46,200 95,800 27,800 21,200 46,800 26,800 $ 21,600 40,500 88,900 28,800 16,800 43,300 24,400 $ 19,300 35,000 78,700 25,600 18,600 34,500 21,800 17,000 $ 25,200 64,000 17,000 12,900 34,100 0.9 22.5% 44.2% 1.0 15.5% 28.7% 0.9 12.9% 24.4% 1.0 11.0% 19.7% 1.3 0.0% 19.2% (Net Inclme - Preffered Dividends) / Weighted Average Number of Common Shares Outstanding
Step by Step Solution
There are 3 Steps involved in it
Step: 1

Get Instant Access to Expert-Tailored Solutions
See step-by-step solutions with expert insights and AI powered tools for academic success
Step: 2

Step: 3
Ace Your Homework with AI
Get the answers you need in no time with our AI-driven, step-by-step assistance
Get Started
Audit Committee Essentials
Authors: Curtis C. Verschoor
1st Edition
0471699594, 978-0471699590