

Answered step by step
Verified Expert Solution
Question
1 Approved Answer
Calculated the daily returns of each stock and their variances and expressed those numbers in annual terms. Provide these numbers in a table. Create a
- Calculated the daily returns of each stock and their variances and expressed those numbers in annual terms. Provide these numbers in a table.
- Create a three month binomial tree with monthly intervals beginning May 19, 2022. Choose an option expiration date as close as possible to 90-days out and a 90 -day treasury expiring as close as possible to 90-days from May 19. (Provide your assumption for the Up move, Down move and risk-neutral probability of the Up move, (i.e. provide numbers)
| June 24 Options | |||
| E = 210 | |||
| Date | Stock Close Price | Call | Put |
| 3/21/2022 | 211.49 | 5.95 | 4.1 |
| 3/22/2022 | 216.65 | 11.5 | 3.28 |
| 3/23/2022 | 213.46 | 8.4 | 3.25 |
| 3/24/2022 | 219.57 | 13.57 | 2.84 |
| 3/25/2022 | 221.82 | 14.95 | 1.4 |
| 3/28/2022 | 223.59 | 16.58 | 1 |
| 3/29/2022 | 229.86 | 22.8 | 1.35 |
| 3/30/2022 | 227.85 | 21.2 | 1.2 |
| 3/31/2022 | 222.36 | 16 | 1.05 |
| 4/1/2022 | 224.85 | 16 | 1.2 |
| 4/4/2022 | 233.89 | 24.89 | 0.75 |
| 4/5/2022 | 231.84 | 23 | 0.8 |
| 4/6/2022 | 223.3 | 18.2 | 1.4 |
| 4/7/2022 | 222.95 | 17.5 | 1.4 |
| 4/8/2022 | 222.33 | 17.4 | 1.42 |
| 4/11/2022 | 216.46 | 10.46 | 3.05 |
| 4/12/2022 | 214.14 | 8 | 4 |
| 4/13/2022 | 214.99 | 8.1 | 4.2 |
| 4/14/2022 | 210.18 | 4.25 | 5.1 |
| 4/18/2022 | 210.77 | 4.7 | 4.95 |
| 4/19/2022 | 217.31 | 10.31 | 4.2 |
| 4/20/2022 | 200.42 | 1.5 | 11.58 |
| 4/21/2022 | 188.07 | 1.5 | 21.6 |
| 4/22/2022 | 184.11 | 1.25 | 27.44 |
| 4/25/2022 | 186.99 | 1.4 | 25.36 |
| 4/26/2022 | 180.95 | 1.4 | 30.1 |
| 4/27/2022 | 174.95 | 0.85 | 35.75 |
| 4/28/2022 | 205.73 | 4.2 | 7.77 |
| 4/29/2022 | 200.47 | 3.15 | 11.55 |
| 5/2/2022 | 211.13 | 4.22 | 4.35 |
| 5/3/2022 | 212.03 | 5.03 | 4.15 |
| 5/4/2022 | 223.41 | 15.2 | 3.5 |
| 5/5/2022 | 208.28 | 3.12 | 3.75 |
| 5/6/2022 | 203.77 | 3 | 8.73 |
| 5/9/2022 | 196.21 | 1.9 | 14.32 |
| 5/10/2022 | 197.65 | 1.94 | 12.65 |
| 5/11/2022 | 188.74 | 1.44 | 21.95 |
| 5/12/2022 | 191.24 | 1.6 | 19.51 |
| 5/13/2022 | 198.62 | 3.01 | 12.66 |
| 5/16/2022 | 200.04 | 2.99 | 11.05 |
| 5/17/2022 | 202.62 | 2.9 | 8.38 |
| 5/18/2022 | 192.24 | 1.6 | 18.12 |
| 5/19/2022 | 191.29 | 1.4 | 19.3 |
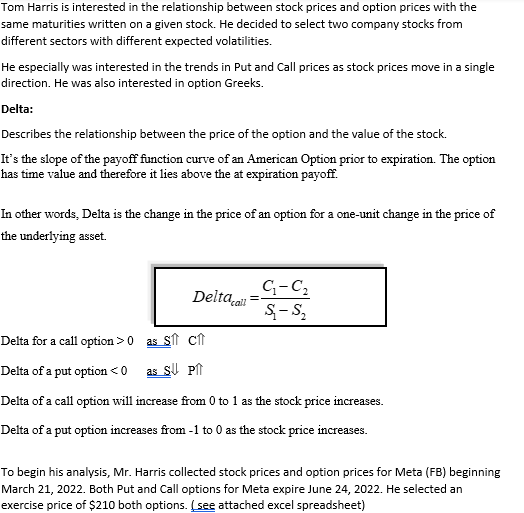
Tom Harris is interested in the relationship between stock prices and option prices with the same maturities written on a given stock. He decided to select two company stocks from different sectors with different expected volatilities. He especially was interested in the trends in Put and Call prices as stock prices move in a single direction. He was also interested in option Greeks. Delta: Describes the relationship between the price of the option and the value of the stock. It's the slope of the payoff function curve of an American Option prior to expiration. The option has time value and therefore it lies above the at expiration payoff. In other words, Delta is the change in the price of an option for a one-unit change in the price of the underlying asset. Delta call C-C S-S Delta for a call option>0 as S C Delta of a put option 0 as S C Delta of a put option
Step by Step Solution
There are 3 Steps involved in it
Step: 1

Get Instant Access to Expert-Tailored Solutions
See step-by-step solutions with expert insights and AI powered tools for academic success
Step: 2

Step: 3
Ace Your Homework with AI
Get the answers you need in no time with our AI-driven, step-by-step assistance
Get Started
Handbook Of Key Global Financial Markets Institutions And Infrastructure
Authors: Gerard Caprio
1st Edition
0123978734, 9780123978738