Answered step by step
Verified Expert Solution
Question
1 Approved Answer
Can I please get some help with this! I already have the Vertical and Horizontal information for the balance sheet. I just need the information
Can I please get some help with this! I already have the Vertical and Horizontal information for the balance sheet. I just need the information for the income statement and ratios. Part 2 being answered would be appreciated as well! Thank you. 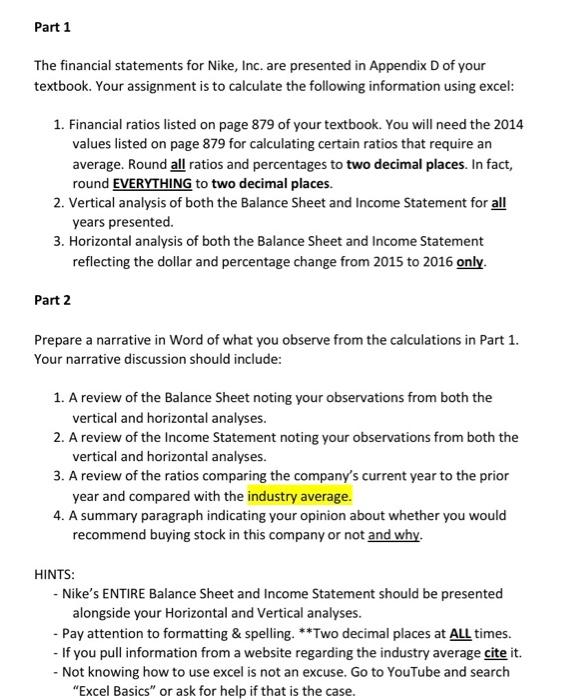

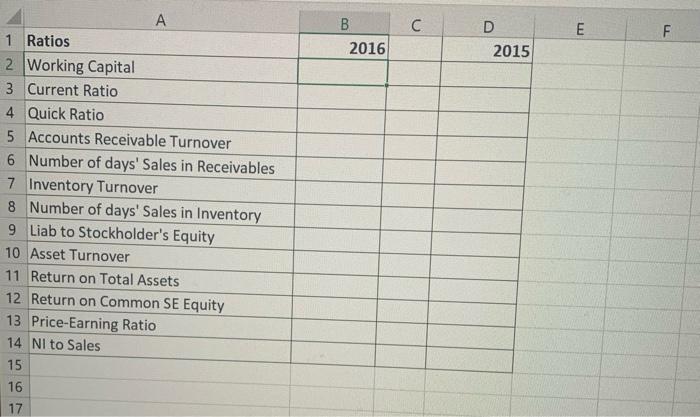
If you could please show me how you got the numbers when plugging them into excel would be helpful as well. Thank you.
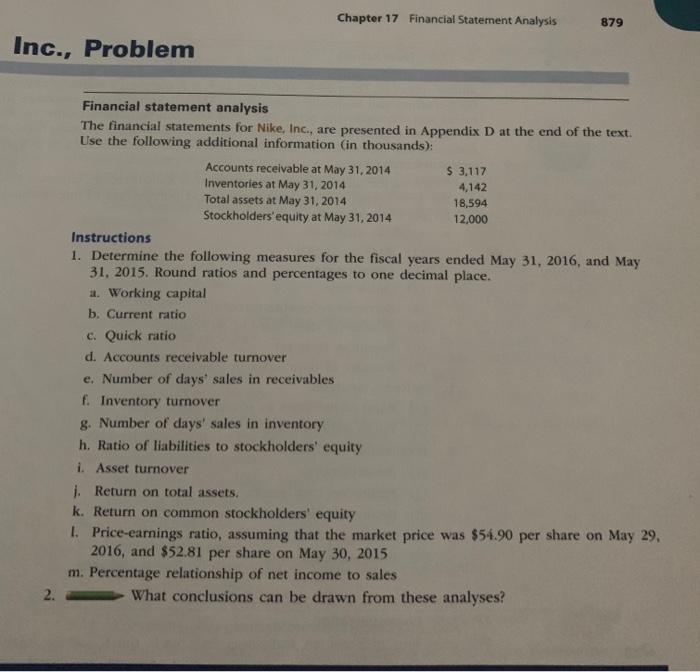
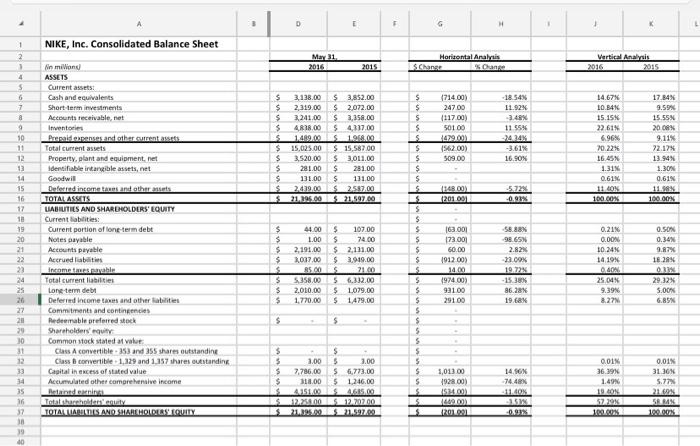
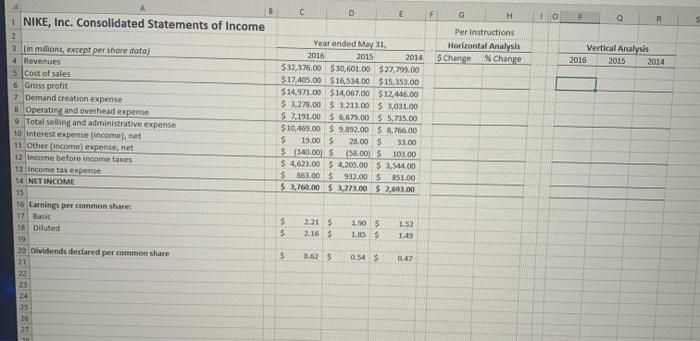
Part 1 The financial statements for Nike, Inc. are presented in Appendix D of your textbook. Your assignment is to calculate the following information using excel: 1. Financial ratios listed on page 879 of your textbook. You will need the 2014 values listed on page 879 for calculating certain ratios that require an average. Round all ratios and percentages to two decimal places. In fact, round EVERYTHING to two decimal places. 2. Vertical analysis of both the Balance Sheet and Income Statement for all years presented. 3. Horizontal analysis of both the Balance Sheet and Income Statement reflecting the dollar and percentage change from 2015 to 2016 only. Part 2 Prepare a narrative in Word of what you observe from the calculations in Part 1. Your narrative discussion should include: 1. A review of the Balance Sheet noting your observations from both the vertical and horizontal analyses. 2. A review of the Income Statement noting your observations from both the vertical and horizontal analyses. 3. A review of the ratios comparing the company's current year to the prior year and compared with the industry average. 4. A summary paragraph indicating your opinion about whether you would recommend buying stock in this company or not and why. HINTS: - Nike's ENTIRE Balance Sheet and Income Statement should be presented alongside your Horizontal and Vertical analyses. -Pay attention to formatting & spelling. **Two decimal places at ALL times. - If you pull information from a website regarding the industry average cite it. - Not knowing how to use excel is not an excuse. Go to YouTube and search "Excel Basics" or ask for help if that is the case. Chapter 17 Financial Statement Analysis 879 Inc., Problem Financial statement analysis The financial statements for Nike, Inc., are presented in Appendix D at the end of the text. Use the following additional information in thousands): Accounts receivable at May 31, 2014 $ 3,117 Inventories at May 31, 2014 4,142 Total assets at May 31, 2014 18,594 Stockholders equity at May 31, 2014 12.000 Instructions 1. Determine the following measures for the fiscal years ended May 31, 2016, and May 31, 2015. Round ratios and percentages to one decimal place. a. Working capital b. Current ratio c. Quick ratio d. Accounts receivable turnover e. Number of days' sales in receivables f. Inventory turnover g. Number of days' sales in inventory h. Ratio of liabilities to stockholders' equity i. Asset turnover 1. Return on total assets. k. Return on common stockholders' equity 1. Price-earnings ratio, assuming that the market price was $54.90 per share on May 29, 2016, and $52.81 per share on May 30, 2015 m. Percentage relationship of net income to sales What conclusions can be drawn from these analyses? 2. H 1 2 NIKE, Inc. Consolidated Balance Sheet May 31 2016 Horizontal Anabis Schane Oange Vertical Analysis 2016 2015 $ $ $ 5 5 $ $ $ $ $ 3.138.00 $ 3.852.00 2,319.00 $2.072.00 3,241.00 $ 2,258.00 4818.00 5 4117,00 149.00 S 1.918.00 15,025.00 $ 15,58700 3.520.00 $ 3,011.00 281.00 $ 281.00 131.00 $ 131.00 2019.00 S 2.517.00 21.395.00 $ 21597.00 171400) 24700 (11700) 50100 14290 (562.00) 509.00 -18.54% 11.02% -3.48% 11 553 14.24% -3.61% 16.90% 14.67% 10.84 15.15 22.61% 6.96% 70.22% 16.45 1.31% 0.61N. 17,84% 9.59% 15.55 2008% 9.11% 22.12% 13.94 1.300 0.61 11.98 100.00 (243.00 1201001 -0.97% 100.00 4 5 6 7 8 9 10 10 12 13 14 15 16 17 18 19 20 21 22 23 24 25 26 27 28 20 30 31 12 33 34 35 16 37 Nin million ASSETS Current assets: Cash and equivalents Short term investments Accounts receivable.net Inventos Prepaid renses and the current assets Total current assets Property, plant and equipment net Identifiable intangible assets, net Goodwil Deferred income tans and other assets TOTAL ASSETS LIABILITIES AND SHAREHOLDERS' EQUITY Current liabilities: Current portion of long-term debt Notes payable Accounts payable Accrued liabilities Income table Total current liabilities Long term debt Deferred Income taxes and other abilities Commitments and contingencies Redeemable preferred stock Shareholders guilty Common stock stated valur Class A convertible 33 and 355 shares outstanding Class convertible 1,129 and 1.157 shares outstanding Capital in excess of stated value Accumulated the comprehensive income Brandon Tatabahay TOTAALALTIES AND SHAREHOLDIOS EQUITY $ $ $ $ 5 5 $ $ 44.00 1.00 2,191.00 2,037.00 25 00 5,358.00 2.000.00 1.770.00 $ $ 5 5 S $ $ $ 5 5 5 5 $ $ $ $ $ 5 5 $ $ 5 $ 5 5 5 5 $ 5 5 5 $ 107.00 $ 74.00 $ 2,111.00 $ 3.919.00 $ 5 6.312.00 $ 1079.00 $ 1.479.00 0.50 0.34% 9.87% 18.28 163.001 173.001 60.00 191200) 14.00 1974.00) 93100 29100 56.88% 98.65 2.82% 23.09% 19.72% -15.38% 86.28% 19.68% 0.21% O.DON. 10.24% 14 10% 0.40 25.04 9.39% 8.27 21.00 29.32% 5.00% 6.85% $ $ - $ 5 $ $ 1.00 7,786.00 11.00 4351.00 12.252.00 21.385.00 $ 5 1.00 56.773.00 5 1.246.00 $ 4635.00 5 12.202.00 $21.592.00 1,013 00 1928 00) ASH.RO 160000) 2012 14.56N 74.48% 11.40 SW 09 0.01% 36.39% 1.49 19 ON 0.01% 31.36 5.77% 21 5 R 199.00 S S 1. 19 40 C D E F G H a Per instructions Horizontal Analysis $ Change % Change Vertical Analysis 2016 2015 2014 B 1 NIKE, Inc. Consolidated Statements of Income 2 3 in milions, except per share data) 4 Revenues Cost of sales o Gross profit 7 Demand creation expense Operating and overhead expense Total selling and administrative expense 10 Interest expense income), net 11 Other Income expense.net 12 Income before income taxes 13 Income tax expense 14 NETINCOME 15 15 Farnings per common share: T7 Basic 18 Diluted 19 20 Dividends declared per common share 21 22 Year ended May 1 2016 2015 2014 $ 37,376.00 $30,601.00 $27,799.00 $17.405.00 $16,534.00 $15,353.00 $14.971.00 $14,067.00 $12.466.00 $ 3,275.00 $ 1211.00 5.3.031.00 $ 7.191.00 $6.679.00 $ 5.235.00 $10,400.00 $ 3.892,00 $ 8,756.00 $ 19.00 $ 28.00 $ 33.00 $ (140.00 5.00) $4,621.00 S 4,205.00 $ 2,544.00 $ 863.005 932.00 S 851.00 $ 1,760.00 $ 1.273.00 $ 21.00 10300 5 $ 2.21 S 2.16 $ 1.908 1115S 1.52 1:49 $ 0.625 0.54 0.42 24 25 26 27 C E B 2016 F D 2015 A 1 Ratios 2 Working Capital 3 Current Ratio 4 Quick Ratio 5 Accounts Receivable Turnover 6 Number of days' Sales in Receivables 7 Inventory Turnover 8 Number of days' Sales in Inventory 9 Liab to Stockholder's Equity 10 Asset Turnover 11 Return on Total Assets 12 Return on Common SE Equity 13 Price-Earning Ratio 14 NI to Sales 15 16 17 Part 1 The financial statements for Nike, Inc. are presented in Appendix D of your textbook. Your assignment is to calculate the following information using excel: 1. Financial ratios listed on page 879 of your textbook. You will need the 2014 values listed on page 879 for calculating certain ratios that require an average. Round all ratios and percentages to two decimal places. In fact, round EVERYTHING to two decimal places. 2. Vertical analysis of both the Balance Sheet and Income Statement for all years presented. 3. Horizontal analysis of both the Balance Sheet and Income Statement reflecting the dollar and percentage change from 2015 to 2016 only. Part 2 Prepare a narrative in Word of what you observe from the calculations in Part 1. Your narrative discussion should include: 1. A review of the Balance Sheet noting your observations from both the vertical and horizontal analyses. 2. A review of the Income Statement noting your observations from both the vertical and horizontal analyses. 3. A review of the ratios comparing the company's current year to the prior year and compared with the industry average. 4. A summary paragraph indicating your opinion about whether you would recommend buying stock in this company or not and why. HINTS: - Nike's ENTIRE Balance Sheet and Income Statement should be presented alongside your Horizontal and Vertical analyses. -Pay attention to formatting & spelling. **Two decimal places at ALL times. - If you pull information from a website regarding the industry average cite it. - Not knowing how to use excel is not an excuse. Go to YouTube and search "Excel Basics" or ask for help if that is the case. Chapter 17 Financial Statement Analysis 879 Inc., Problem Financial statement analysis The financial statements for Nike, Inc., are presented in Appendix D at the end of the text. Use the following additional information in thousands): Accounts receivable at May 31, 2014 $ 3,117 Inventories at May 31, 2014 4,142 Total assets at May 31, 2014 18,594 Stockholders equity at May 31, 2014 12.000 Instructions 1. Determine the following measures for the fiscal years ended May 31, 2016, and May 31, 2015. Round ratios and percentages to one decimal place. a. Working capital b. Current ratio c. Quick ratio d. Accounts receivable turnover e. Number of days' sales in receivables f. Inventory turnover g. Number of days' sales in inventory h. Ratio of liabilities to stockholders' equity i. Asset turnover 1. Return on total assets. k. Return on common stockholders' equity 1. Price-earnings ratio, assuming that the market price was $54.90 per share on May 29, 2016, and $52.81 per share on May 30, 2015 m. Percentage relationship of net income to sales What conclusions can be drawn from these analyses? 2. H 1 2 NIKE, Inc. Consolidated Balance Sheet May 31 2016 Horizontal Anabis Schane Oange Vertical Analysis 2016 2015 $ $ $ 5 5 $ $ $ $ $ 3.138.00 $ 3.852.00 2,319.00 $2.072.00 3,241.00 $ 2,258.00 4818.00 5 4117,00 149.00 S 1.918.00 15,025.00 $ 15,58700 3.520.00 $ 3,011.00 281.00 $ 281.00 131.00 $ 131.00 2019.00 S 2.517.00 21.395.00 $ 21597.00 171400) 24700 (11700) 50100 14290 (562.00) 509.00 -18.54% 11.02% -3.48% 11 553 14.24% -3.61% 16.90% 14.67% 10.84 15.15 22.61% 6.96% 70.22% 16.45 1.31% 0.61N. 17,84% 9.59% 15.55 2008% 9.11% 22.12% 13.94 1.300 0.61 11.98 100.00 (243.00 1201001 -0.97% 100.00 4 5 6 7 8 9 10 10 12 13 14 15 16 17 18 19 20 21 22 23 24 25 26 27 28 20 30 31 12 33 34 35 16 37 Nin million ASSETS Current assets: Cash and equivalents Short term investments Accounts receivable.net Inventos Prepaid renses and the current assets Total current assets Property, plant and equipment net Identifiable intangible assets, net Goodwil Deferred income tans and other assets TOTAL ASSETS LIABILITIES AND SHAREHOLDERS' EQUITY Current liabilities: Current portion of long-term debt Notes payable Accounts payable Accrued liabilities Income table Total current liabilities Long term debt Deferred Income taxes and other abilities Commitments and contingencies Redeemable preferred stock Shareholders guilty Common stock stated valur Class A convertible 33 and 355 shares outstanding Class convertible 1,129 and 1.157 shares outstanding Capital in excess of stated value Accumulated the comprehensive income Brandon Tatabahay TOTAALALTIES AND SHAREHOLDIOS EQUITY $ $ $ $ 5 5 $ $ 44.00 1.00 2,191.00 2,037.00 25 00 5,358.00 2.000.00 1.770.00 $ $ 5 5 S $ $ $ 5 5 5 5 $ $ $ $ $ 5 5 $ $ 5 $ 5 5 5 5 $ 5 5 5 $ 107.00 $ 74.00 $ 2,111.00 $ 3.919.00 $ 5 6.312.00 $ 1079.00 $ 1.479.00 0.50 0.34% 9.87% 18.28 163.001 173.001 60.00 191200) 14.00 1974.00) 93100 29100 56.88% 98.65 2.82% 23.09% 19.72% -15.38% 86.28% 19.68% 0.21% O.DON. 10.24% 14 10% 0.40 25.04 9.39% 8.27 21.00 29.32% 5.00% 6.85% $ $ - $ 5 $ $ 1.00 7,786.00 11.00 4351.00 12.252.00 21.385.00 $ 5 1.00 56.773.00 5 1.246.00 $ 4635.00 5 12.202.00 $21.592.00 1,013 00 1928 00) ASH.RO 160000) 2012 14.56N 74.48% 11.40 SW 09 0.01% 36.39% 1.49 19 ON 0.01% 31.36 5.77% 21 5 R 199.00 S S 1. 19 40 C D E F G H a Per instructions Horizontal Analysis $ Change % Change Vertical Analysis 2016 2015 2014 B 1 NIKE, Inc. Consolidated Statements of Income 2 3 in milions, except per share data) 4 Revenues Cost of sales o Gross profit 7 Demand creation expense Operating and overhead expense Total selling and administrative expense 10 Interest expense income), net 11 Other Income expense.net 12 Income before income taxes 13 Income tax expense 14 NETINCOME 15 15 Farnings per common share: T7 Basic 18 Diluted 19 20 Dividends declared per common share 21 22 Year ended May 1 2016 2015 2014 $ 37,376.00 $30,601.00 $27,799.00 $17.405.00 $16,534.00 $15,353.00 $14.971.00 $14,067.00 $12.466.00 $ 3,275.00 $ 1211.00 5.3.031.00 $ 7.191.00 $6.679.00 $ 5.235.00 $10,400.00 $ 3.892,00 $ 8,756.00 $ 19.00 $ 28.00 $ 33.00 $ (140.00 5.00) $4,621.00 S 4,205.00 $ 2,544.00 $ 863.005 932.00 S 851.00 $ 1,760.00 $ 1.273.00 $ 21.00 10300 5 $ 2.21 S 2.16 $ 1.908 1115S 1.52 1:49 $ 0.625 0.54 0.42 24 25 26 27 C E B 2016 F D 2015 A 1 Ratios 2 Working Capital 3 Current Ratio 4 Quick Ratio 5 Accounts Receivable Turnover 6 Number of days' Sales in Receivables 7 Inventory Turnover 8 Number of days' Sales in Inventory 9 Liab to Stockholder's Equity 10 Asset Turnover 11 Return on Total Assets 12 Return on Common SE Equity 13 Price-Earning Ratio 14 NI to Sales 15 16 17 Step by Step Solution
There are 3 Steps involved in it
Step: 1

Get Instant Access to Expert-Tailored Solutions
See step-by-step solutions with expert insights and AI powered tools for academic success
Step: 2

Step: 3

Ace Your Homework with AI
Get the answers you need in no time with our AI-driven, step-by-step assistance
Get Started


