 can u find the slope for balance 1 and 2
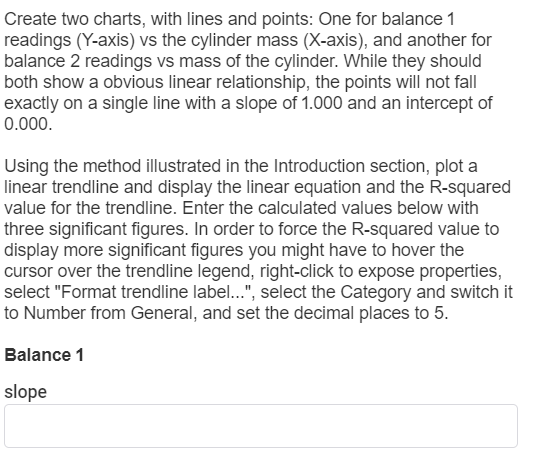
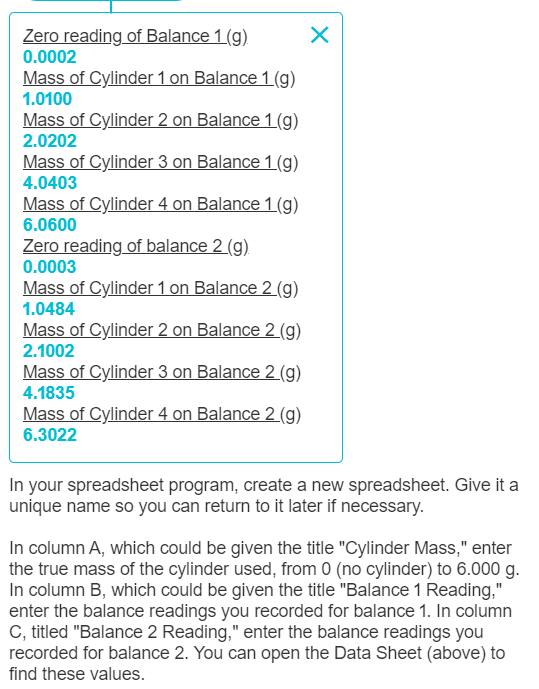
Create two charts, with lines and points: One for balance 1 readings (Y-axis) vs the cylinder mass (X-axis), and another for balance 2 readings vs mass of the cylinder. While they should both show a obvious linear relationship, the points will not fall exactly on a single line with a slope of 1.000 and an intercept of 0.000. Using the method illustrated in the Introduction section, plot a linear trendline and display the linear equation and the R-squared value for the trendline. Enter the calculated values below with three significant figures. In order to force the R-squared value to display more significant figures you might have to hover the cursor over the trendline legend, right-click to expose properties, select "Format trendline label...", select the Category and switch it to Number from General, and set the decimal places to 5. Balance 1 slope X Zero reading of Balance 1(9) 0.0002 Mass of Cylinder 1 on Balance 1(9) 1.0100 Mass of Cylinder 2 on Balance 1(9) 2.0202 Mass of Cylinder 3 on Balance 1(9) 4.0403 Mass of Cylinder 4 on Balance 1(9) 6.0600 Zero reading of balance 2 (9) 0.0003 Mass of Cylinder 1 on Balance 2 (9) 1.0484 Mass of Cylinder 2 on Balance 2 (9) 2.1002 Mass of Cylinder 3 on Balance 2 (9) 4.1835 Mass of Cylinder 4 on Balance 2 (9) 6.3022 In your spreadsheet program, create a new spreadsheet. Give it a unique name so you can return to it later if necessary. In column A, which could be given the title "Cylinder Mass," enter the true mass of the cylinder used, from 0 (no cylinder) to 6.000 g. In column B, which could be given the title "Balance 1 Reading," enter the balance readings you recorded for balance 1. In column C, titled "Balance 2 Reading," enter the balance readings you recorded for balance 2. You can open the Data Sheet (above) to find these values. Create two charts, with lines and points: One for balance 1 readings (Y-axis) vs the cylinder mass (X-axis), and another for balance 2 readings vs mass of the cylinder. While they should both show a obvious linear relationship, the points will not fall exactly on a single line with a slope of 1.000 and an intercept of 0.000. Using the method illustrated in the Introduction section, plot a linear trendline and display the linear equation and the R-squared value for the trendline. Enter the calculated values below with three significant figures. In order to force the R-squared value to display more significant figures you might have to hover the cursor over the trendline legend, right-click to expose properties, select "Format trendline label...", select the Category and switch it to Number from General, and set the decimal places to 5. Balance 1 slope X Zero reading of Balance 1(9) 0.0002 Mass of Cylinder 1 on Balance 1(9) 1.0100 Mass of Cylinder 2 on Balance 1(9) 2.0202 Mass of Cylinder 3 on Balance 1(9) 4.0403 Mass of Cylinder 4 on Balance 1(9) 6.0600 Zero reading of balance 2 (9) 0.0003 Mass of Cylinder 1 on Balance 2 (9) 1.0484 Mass of Cylinder 2 on Balance 2 (9) 2.1002 Mass of Cylinder 3 on Balance 2 (9) 4.1835 Mass of Cylinder 4 on Balance 2 (9) 6.3022 In your spreadsheet program, create a new spreadsheet. Give it a unique name so you can return to it later if necessary. In column A, which could be given the title "Cylinder Mass," enter the true mass of the cylinder used, from 0 (no cylinder) to 6.000 g. In column B, which could be given the title "Balance 1 Reading," enter the balance readings you recorded for balance 1. In column C, titled "Balance 2 Reading," enter the balance readings you recorded for balance 2. You can open the Data Sheet (above) to find these values