Answered step by step
Verified Expert Solution
Question
1 Approved Answer
can you please help me with these questions, I have included all the data needed. Thank you. Data And Report Submission - Molar Mass Of
can you please help me with these questions, I have included all the data needed. Thank you. 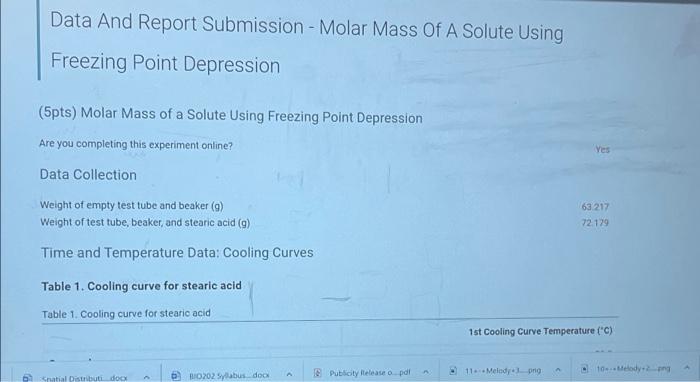
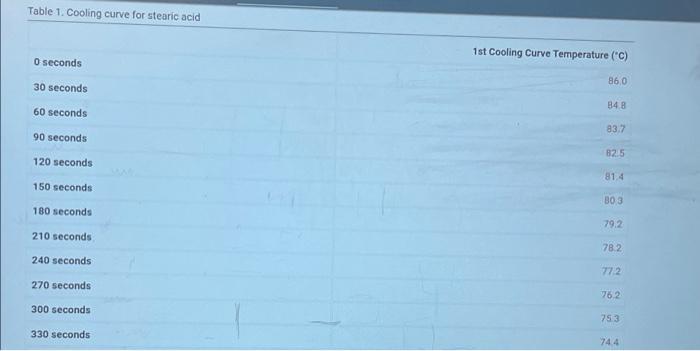
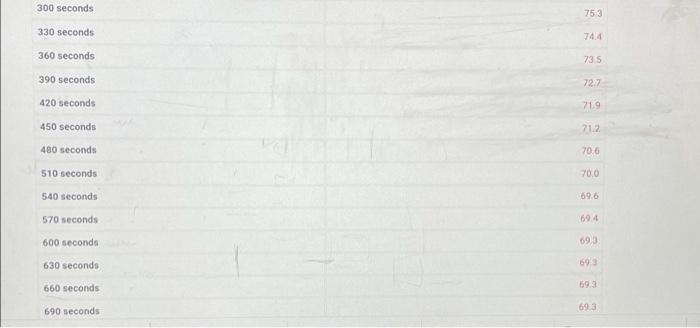
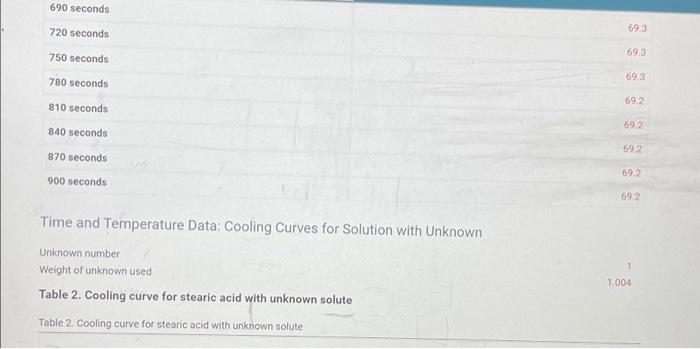
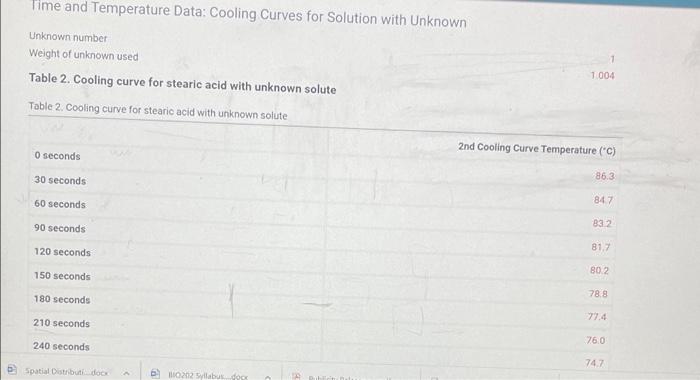
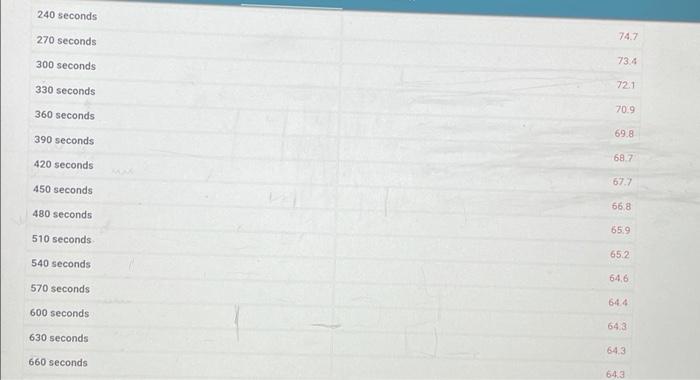
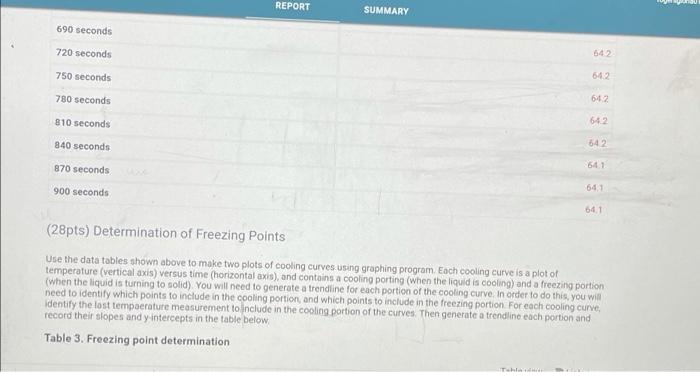
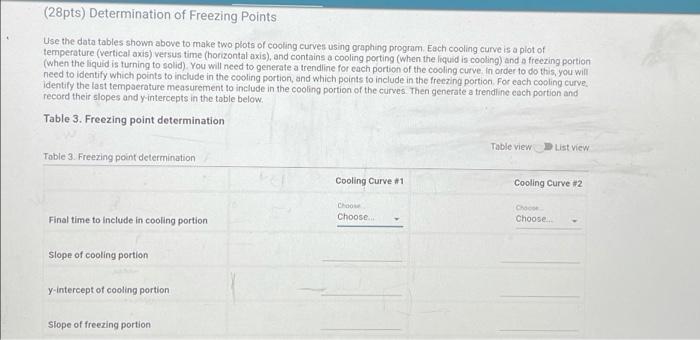
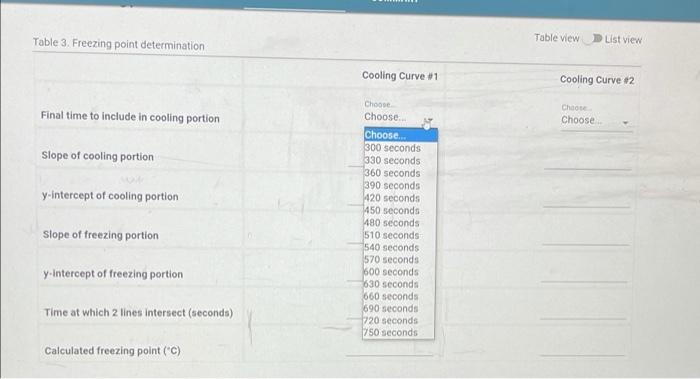
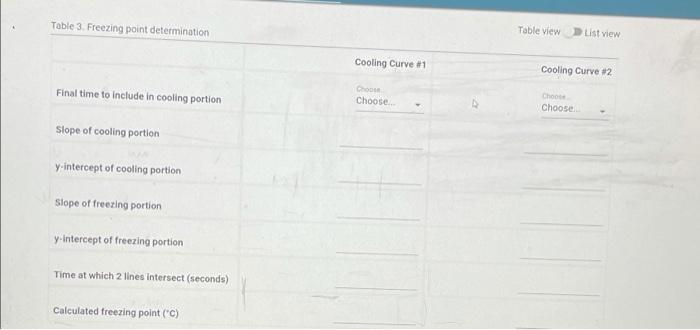
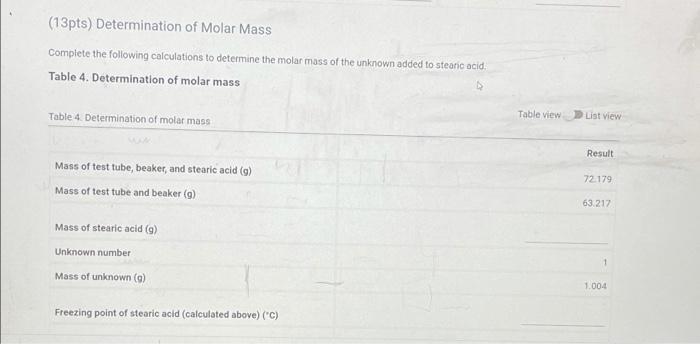
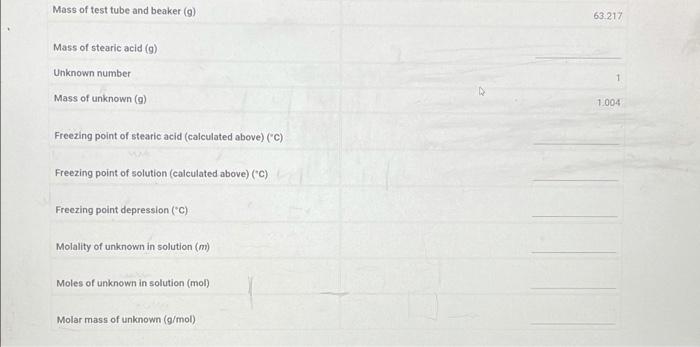
Data And Report Submission - Molar Mass Of A Solute Using Freezing Point Depression (5pts) Molar Mass of a Solute Using Freezing Point Depression Are you completing this experiment online? Yes Data Collection 63217 72.129 Weight of empty test tube and beaker (9) Weight of test tube, beaker, and stearic acid (9) Time and Temperature Data: Cooling Curves Table 1. Cooling curve for stearic acid Table 1. Cooling curve for stearic acid 1st Cooling Curve Temperature (C) ratial Distributi doo Publicity Itelease opal 11. Melody pro HO02 Sabus docx 10.Medy? Table 1. Cooling curve for stearic acid 1st Cooling Curve Temperature (C) O seconds 860 30 seconds 60 seconds 848 83.7 90 seconds 825 120 seconds 81.4 150 seconds 303 180 seconds 79.2 210 seconds 78.2 240 seconds 772 270 seconds 162 300 seconds 753 330 seconds 74.4 300 seconds 753 74.4 735 72.7 71.9 212 330 seconds 360 seconds 390 seconds 420 seconds 450 seconds 480 seconds 510 seconds 540 seconds 570 seconds 600 secondo 706 70.0 69.6 69.4 693 630 seconds 693 660 seconds 693 690 seconds 693 690 seconds 720 seconds 69.3 69.3 750 seconds 69.3 780 seconds 69.2 810 seconds 692 69.2 840 seconds 870 seconds 900 seconds 69.2 69.2 Time and Temperature Data: Cooling Curves for Solution with Unknown 1 Unknown number Weight of unknown used Table 2. Cooling curve for stearic acid with unknown solute 1.004 Table 2. Cooling curve for stearic acid with unknown solute Time and Temperature Data: Cooling Curves for Solution with Unknown Unknown number 1 Weight of unknown used 1.004 Table 2. Cooling curve for stearic acid with unknown solute Table 2. Cooling curve for stearic acid with unknown solute 2nd Cooling Curve Temperature (C) O seconds 86.3 30 seconds 847 60 seconds 832 90 seconds 81.7 120 seconds 80.2 150 seconds 78.8 180 seconds 210 seconds 77.4 240 seconds 76.0 747 Spatial Distribution 10202 Silabuso 240 seconds 270 seconds 74.7 300 seconds 73.4 330 seconds 72.1 70,9 69.8 360 seconds 390 seconds 420 seconds 450 seconds 687 67.7 668 480 seconds 659 510 seconds 65.2 540 seconds 646 570 seconds 600 seconds 64.4 64,3 630 seconds 643 660 seconds 643 REPORT SUMMARY 690 seconds 720 seconds 642 750 seconds 642 780 seconds 642 810 seconds 642 840 seconds 642 870 seconds 900 seconds 641 64.1 (28pts) Determination of Freezing Points Use the data tables shown above to make two plots of cooling curves using graphing program Each cooling curve is a plot of temperature (vertical axis) versus time (horizontal axis), and contains a cooling porting (When the liquid is cooling) and a freezing portion (when the liquid is turning to solid). You will need to generate a trendline for each portion of the cooling curve. In order to do this, you will need to identify which points to include in the cooling portion, and which points to include in the freezing portion For each cooling curve, Identify the lost temperature measurement to include in the cooling portion of the curves. Then generate a trendline each portion and record their slopes and y-intercepts in the table below Table 3. Freezing point determination (28pts) Determination of Freezing Points Use the data tables shown above to make two plots of cooling curves using graphing program. Each cooling curve is a plot of temperature (vertical axis) versus time (horizontal axis), and contains a cooling porting (when the liquid is cooling) and a freezing portion (when the liquid is turning to solid). You will need to generate a trendline for each portion of the cooling curve. In order to do this, you will need to identify which points to include in the cooling portion, and which points to include in the freezing portion For each cooling curve. identify the last temperature measurement to include in the cooling portion of the curves. Then generate a trendline each portion and record their slopes and y intercepts in the toble below. Table 3. Freezing point determination Table view List View Table 3. Freezing point determination Cooling Curve #1 Cooling Curve 2 Choo Choose Final time to include in cooling portion Chooon Choose Slope of cooling portion y-intercept of cooling portion slope of freezing portion Table view Table 3. Freezing point determination List view Cooling Curve #1 Cooling Curve 12 Final time to include in cooling portion Choose Choose Slope of cooling portion y-intercept of cooling portion Choose Choose Choose 300 seconds 330 seconds 360 seconds 390 seconds 420 seconds 450 seconds 480 seconds 510 seconds 540 seconds 570 seconds 600 seconds $30 seconds 660 seconds 690 seconds 720 seconds 750 seconds Slope of freezing portion y-Intercept of freezing portion Time at which 2 lines intersect (seconds) Calculated freezing point (C) Table 3. Freezing point determination Table view List view Cooling Curve #1 Cooling Curve #2 Final time to include in cooling portion Choose Choose Choo Choose Slope of cooling portion y-intercept of cooling portion Slope of freezing portion y.Intercept of freezing portion Time at which 2 lines intersect (seconds) Calculated freezing point (C) (13pts) Determination of Molar Mass Complete the following calculations to determine the molar mass of the unknown added to stearic acid Table 4. Determination of molar mass Table 4 Determination of molar mass Table view List view Result Mass of test tube, beaker, and stearic acid (g) Mass of test tube and beaker (9) 72179 63 217 Mass of stearic acid (9) Unknown number 1 Mass of unknown (9) 1.004 Freezing point of stearic acid (calculated above) (C) Mass of test tube and beaker (9) 63.217 Mass of stearic acid (a) Unknown number Mass of unknown (g) 1 1.004 Freezing point of stearic acid (calculated above) (C) Freezing point of solution (calculated above) ("C) Freezing point depression (C) Molality of unknown in solution (m) Moles of unknown in solution (mol) Molar mass of unknown (g/mol) 


Step by Step Solution
There are 3 Steps involved in it
Step: 1

Get Instant Access to Expert-Tailored Solutions
See step-by-step solutions with expert insights and AI powered tools for academic success
Step: 2

Step: 3

Ace Your Homework with AI
Get the answers you need in no time with our AI-driven, step-by-step assistance
Get Started


