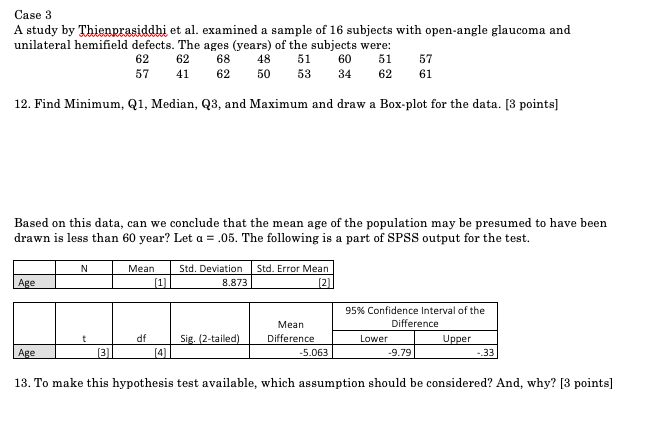
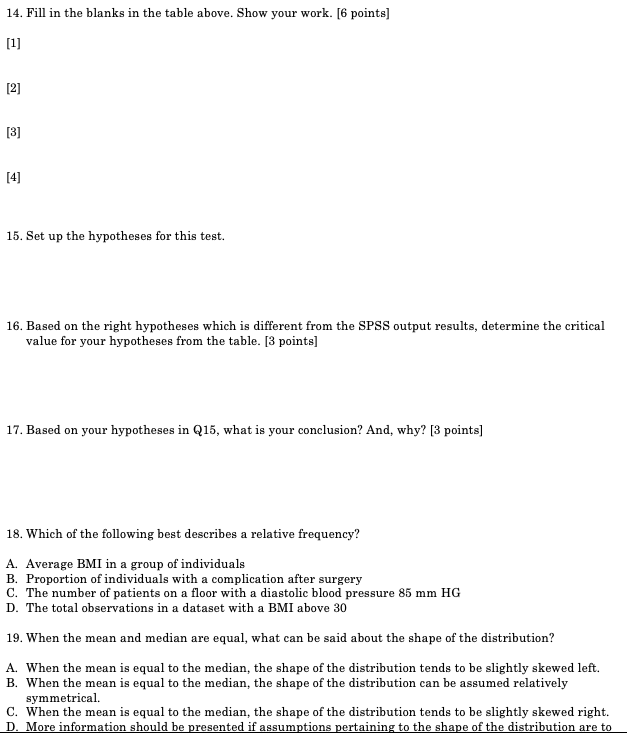
Case 3 A study by Thienprasiddhi et al. examined a sample of 16 subjects with open-angle glaucoma and unilateral hemifield defects. The ages (years) of the subjects were: 62 62 68 48 51 60 51 57 57 41 62 50 53 34 62 61 12. Find Minimum, Q1, Median, Q3, and Maximum and draw a Box-plot for the data. [3 points] Based on this data, can we conclude that the mean age of the population may be presumed to have been drawn is less than 60 year? Let a = .05. The following is a part of SPSS output for the test. N Mean Std. Deviation Std. Error Mean Age [1] 8.873 [2] 95% Confidence Interval of the Mean Difference df Sig. (2-tailed) Difference Lower Upper Age [3] -5.063 -9.79 -.33 13. To make this hypothesis test available, which assumption should be considered? And, why? [3 points]14. Fill in the blanks in the table above. Show your work. [6 points] [1] [2] [3] [4] 15. Set up the hypotheses for this test. 16. Based on the right hypotheses which is different from the SPSS output results, determine the critical value for your hypotheses from the table. [3 points] 17. Based on your hypotheses in Q15, what is your conclusion? And, why? [3 points] 18. Which of the following best describes a relative frequency? A. Average BMI in a group of individuals B. Proportion of individuals with a complication after surgery C. The number of patients on a floor with a diastolic blood pressure 85 mm HG D. The total observations in a dataset with a BMI above 30 19. When the mean and median are equal, what can be said about the shape of the distribution? A. When the mean is equal to the median, the shape of the distribution tends to be slightly skewed left. B. When the mean is equal to the median, the shape of the distribution can be assumed relatively symmetrical. C. When the mean is equal to the median, the shape of the distribution tends to be slightly skewed right. D. More information should be presented if assumptions pertaining to the shape of the distribution are to