Question
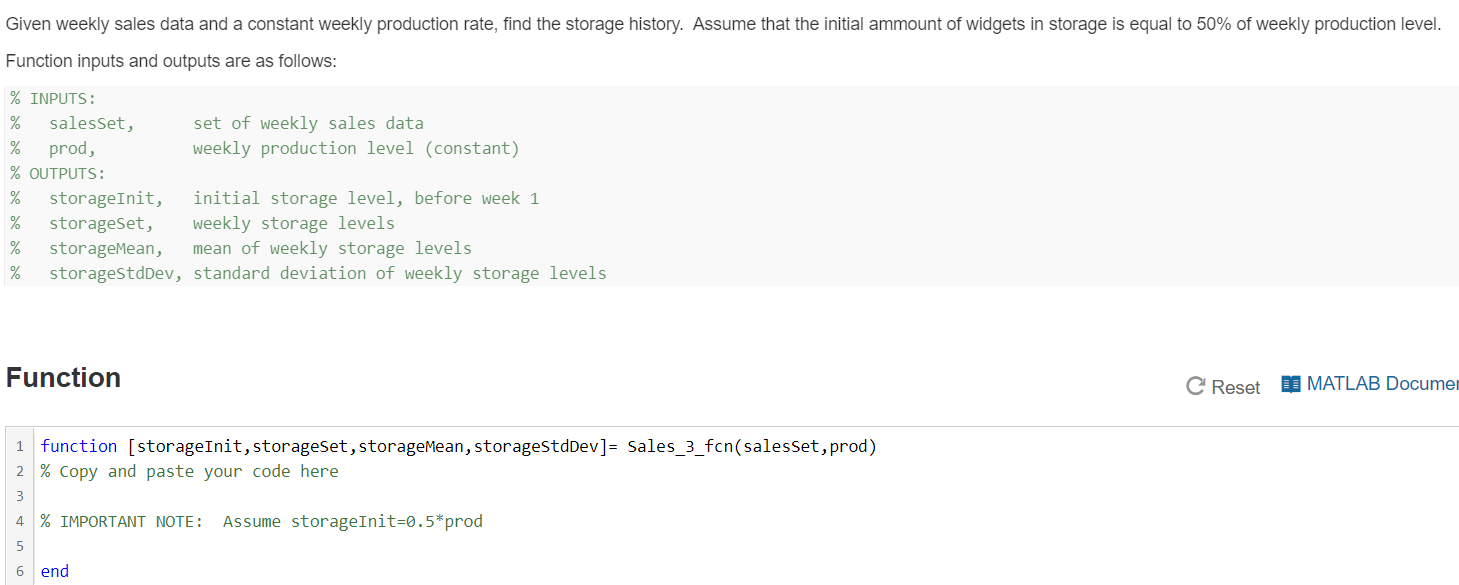
Case 3- Matlab code toc all function % Case 3: Given a history of weekly sales and a production process with % constant weekly output,
Case 3- Matlab
code toc all function
% Case 3: Given a history of weekly sales and a production process with
% constant weekly output, find the storage history.
% INPUTS:
% salesSet, set of weekly sales data
% prod, weekly production level (constant)
% OUTPUTS:
% storageInit, initial storage level, before week 1
% storageSet, weekly storage levels
% storageMean, mean of weekly storage levels
% storageStdDev, standard deviation of weekly storage levels
% -------------------------------------------------------------------------
% SETUP SECTION -----------------------------------------------------------
mu= 1000; % sales average per week
sigma= 100; % sales standard deviation
nweeks= 104;
load('Case3Data.mat'); % loads the variable salesSet
prod= 1000;
% SIMULATION SECTION ------------------------------------------------------
[storageInit,storageSet,storageMean,storageStdDev]= Sales_3_fcn(salesSet,prod);
% REPORT SECTION ----------------------------------------------------------
% setup conditions
fprintf(' Setup 3: ');
fprintf(' nweeks=%6.0f ',nweeks);
fprintf(' mu= %6.0f ',mu);
fprintf(' sigma= %6.0f ',sigma);
fprintf(' prod= %6.0f ',prod);
salesMean= mean(salesSet);
fprintf(' salesMean= %6.0f ',salesMean);
salesStdDev= std(salesSet);
fprintf(' salesStdDev= %6.0f ',salesStdDev);
% results
fprintf(' Results 3: ');
fprintf(' storageInit= %6.0f ',storageInit);
fprintf(' storageMean= %6.0f ',storageMean);
fprintf(' storageStdDev= %6.0f ',storageStdDev);
storageMin= min(storageSet);
fprintf(' storageMin= %6.0f ',storageMin);
storageMax= max(storageSet);
fprintf(' storageMax= %6.0f ',storageMax);
% plot results
figure
x= 1:1:nweeks;
subplot(3,1,1)
plot(x,salesSet);
grid on;
hold on;
xline= [1,nweeks];
yline= [salesMean,salesMean];
plot(xline,yline,'k')
hold off;
xlabel('weeks');
ylabel('sales');
title('Case 3: Production level constant.');
subplot(3,1,2)
plot(x,storageSet);
grid on;
hold on;
xline= [1,nweeks];
yline= [storageMean,storageMean];
plot(xline,yline,'k')
hold off;
%xlabel('weeks');
ylabel('storage level');
subplot(3,1,3)
netstore= prod*ones(1,nweeks) -salesSet;
plot(x,netstore);
grid on;
%xlabel('weeks');
ylabel('netstore= prod-sales');
fprintf(' ');
% -------------------------------------------------------------------------
Step by Step Solution
There are 3 Steps involved in it
Step: 1

Get Instant Access to Expert-Tailored Solutions
See step-by-step solutions with expert insights and AI powered tools for academic success
Step: 2

Step: 3

Ace Your Homework with AI
Get the answers you need in no time with our AI-driven, step-by-step assistance
Get Started


