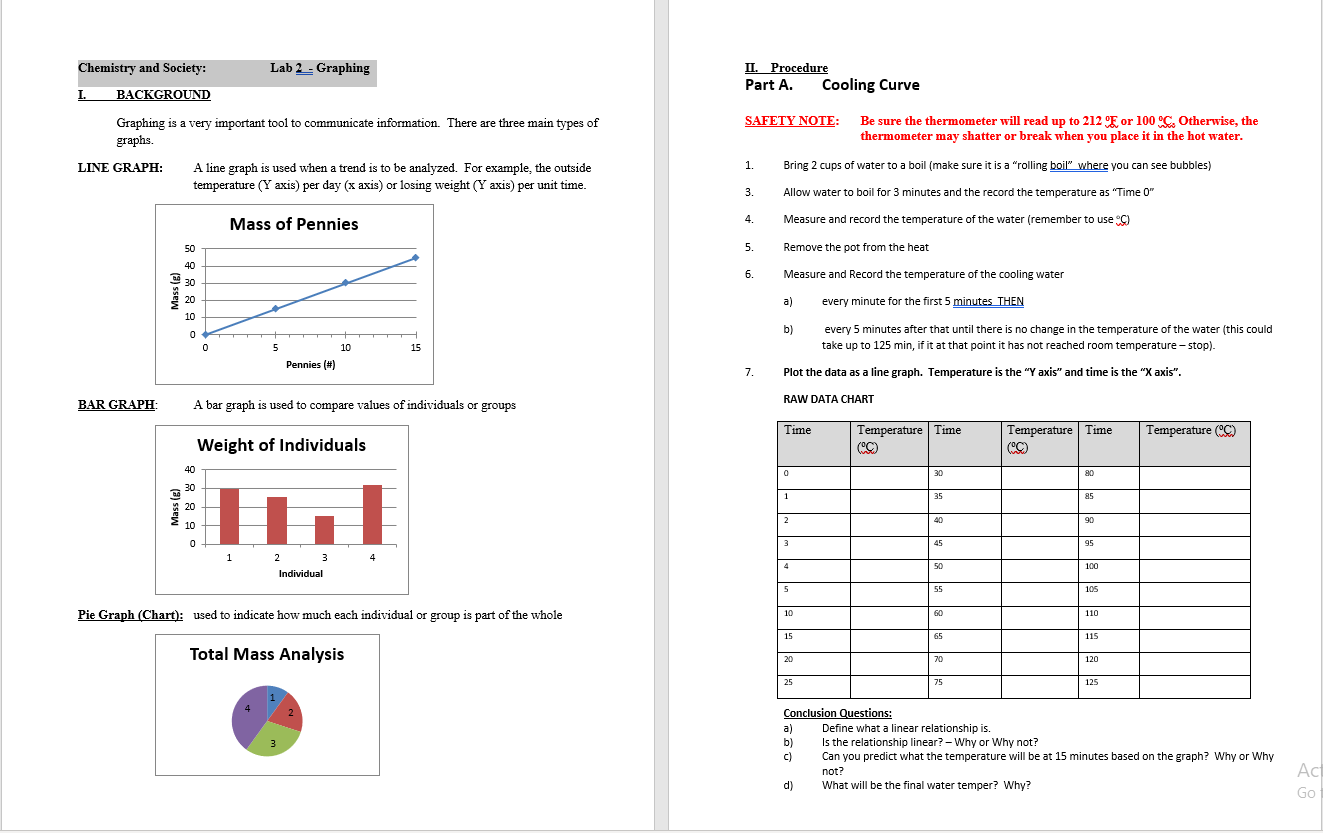
Chemistry and Society: Lab 2 Graphing II. Procedure I. BACKGROUND Part A. Cooling Curve Graphing is a very important tool to communicate information. There are three main types of SAFETY NOTE: Be sure the thermometer will read up to 212E or 100C Otherwise, the graphs. thermometer may shatter or break when you place it in the hot water. LINE GRAPH: A line graph is used when a trend is to be analyzed. For example, the outside 1. Bring 2 cups of water to a boil (make sure it is a "rolling boil" where you can see bubbles) temperature ( Y axis) per day ( x axis) or losing weight ( Y axis) per unit time. 3. Allow water to boil for 3 minutes and the record the temperature as "Time 0 " 4. Measure and record the temperature of the water (remember to use C ) 5. Remove the pot from the heat 6. Measure and Record the temperature of the cooling water a) every minute for the first 5 minutes THEN b) every 5 minutes after that until there is no change in the temperature of the water (this could take up to 125min, if it at that point it has not reached room temperature - stop). 7. Plot the data as a line graph. Temperature is the "Y axis" and time is the " X axis". BAR GRAPH: A bar graph is used to compare values of individuals or groups RAW DATA CHART Pie Graph (Chart): used to indicate how much each individual or group is part of the whole Conclusion Questions: a) Define what a linear relationship is. b) Is the relationship linear? - Why or Why not? c) Can you predict what the temperature will be at 15 minutes based on the graph? Why or Why not? d) What will be the final water temper? Why? Chemistry and Society: Lab 2 Graphing II. Procedure I. BACKGROUND Part A. Cooling Curve Graphing is a very important tool to communicate information. There are three main types of SAFETY NOTE: Be sure the thermometer will read up to 212E or 100C Otherwise, the graphs. thermometer may shatter or break when you place it in the hot water. LINE GRAPH: A line graph is used when a trend is to be analyzed. For example, the outside 1. Bring 2 cups of water to a boil (make sure it is a "rolling boil" where you can see bubbles) temperature ( Y axis) per day ( x axis) or losing weight ( Y axis) per unit time. 3. Allow water to boil for 3 minutes and the record the temperature as "Time 0 " 4. Measure and record the temperature of the water (remember to use C ) 5. Remove the pot from the heat 6. Measure and Record the temperature of the cooling water a) every minute for the first 5 minutes THEN b) every 5 minutes after that until there is no change in the temperature of the water (this could take up to 125min, if it at that point it has not reached room temperature - stop). 7. Plot the data as a line graph. Temperature is the "Y axis" and time is the " X axis". BAR GRAPH: A bar graph is used to compare values of individuals or groups RAW DATA CHART Pie Graph (Chart): used to indicate how much each individual or group is part of the whole Conclusion Questions: a) Define what a linear relationship is. b) Is the relationship linear? - Why or Why not? c) Can you predict what the temperature will be at 15 minutes based on the graph? Why or Why not? d) What will be the final water temper? Why


