
- Compare the results from each of the three months to the original data and to each other
- Do not just state the numbers - indicate what the numbers are telling us
- Mention what will help make business decisions (be specific - make recommendations to a client)
- The explanations should be brief like bullet points (not lengthy sentences, not a paragraph)
- The explanations should include graphics (up arrow for increase, down arrow for decrease, etc.)
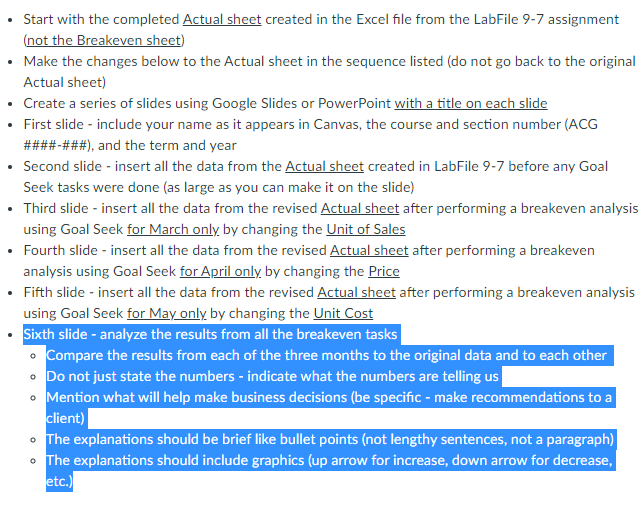
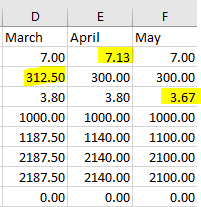
. . . . Start with the completed Actual sheet created in the Excel file from the LabFile 9-7 assignment (not the Breakeven sheet) Make the changes below to the Actual sheet in the sequence listed (do not go back to the original Actual sheet) Create a series of slides using Google Slides or PowerPoint with a title on each slide First slide - include your name as it appears in Canvas, the course and section number (ACG ####-###), and the term and year Second slide - insert all the data from the Actual sheet created in LabFile 9-7 before any Goal Seek tasks were done (as large as you can make it on the slide) Third slide - insert all the data from the revised Actual sheet after performing a breakeven analysis using Goal Seek for March only by changing the Unit of Sales Fourth slide - insert all the data from the revised Actual sheet after performing a breakeven analysis using Goal Seek for April only by changing the Price Fifth slide - insert all the data from the revised Actual sheet after performing a breakeven analysis using Goal Seek for May only by changing the Unit Cost Sixth slide - analyze the results from all the breakeven tasks Compare the results from each of the three months to the original data and to each other . Do not just state the numbers - indicate what the numbers are telling us Mention what will help make business decisions (be specific - make recommendations to a client) . The explanations should be brief like bullet points (not lengthy sentences, not a paragraph) The explanations should include graphics (up arrow for increase, down arrow for decrease, etc.) D E F March April May 7.00 7.13 7.00 312.50 300.00 300.00 3.80 3.80 3.67 1000.00 1000.00 1000.00 1187.50 1140.00 1100.00 2187.50 2140.00 2140.00 2100.00 2187.50 2140.00 2100.00 0.00 0.00 0.00 . . . . Start with the completed Actual sheet created in the Excel file from the LabFile 9-7 assignment (not the Breakeven sheet) Make the changes below to the Actual sheet in the sequence listed (do not go back to the original Actual sheet) Create a series of slides using Google Slides or PowerPoint with a title on each slide First slide - include your name as it appears in Canvas, the course and section number (ACG ####-###), and the term and year Second slide - insert all the data from the Actual sheet created in LabFile 9-7 before any Goal Seek tasks were done (as large as you can make it on the slide) Third slide - insert all the data from the revised Actual sheet after performing a breakeven analysis using Goal Seek for March only by changing the Unit of Sales Fourth slide - insert all the data from the revised Actual sheet after performing a breakeven analysis using Goal Seek for April only by changing the Price Fifth slide - insert all the data from the revised Actual sheet after performing a breakeven analysis using Goal Seek for May only by changing the Unit Cost Sixth slide - analyze the results from all the breakeven tasks Compare the results from each of the three months to the original data and to each other . Do not just state the numbers - indicate what the numbers are telling us Mention what will help make business decisions (be specific - make recommendations to a client) . The explanations should be brief like bullet points (not lengthy sentences, not a paragraph) The explanations should include graphics (up arrow for increase, down arrow for decrease, etc.) D E F March April May 7.00 7.13 7.00 312.50 300.00 300.00 3.80 3.80 3.67 1000.00 1000.00 1000.00 1187.50 1140.00 1100.00 2187.50 2140.00 2140.00 2100.00 2187.50 2140.00 2100.00 0.00 0.00 0.00


