

Answered step by step
Verified Expert Solution
Question
1 Approved Answer
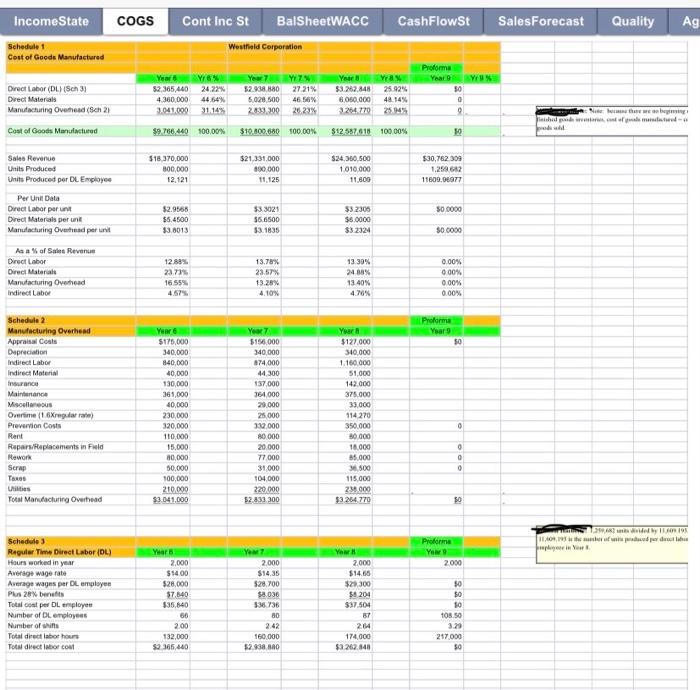
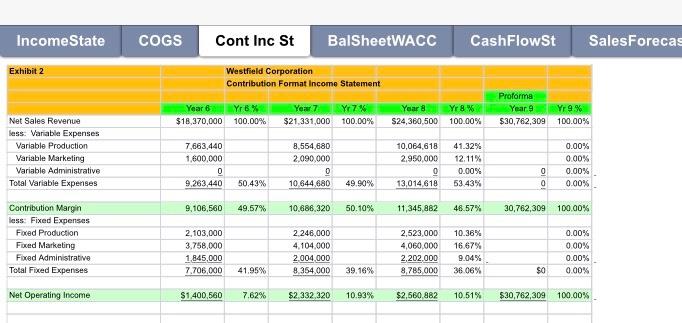
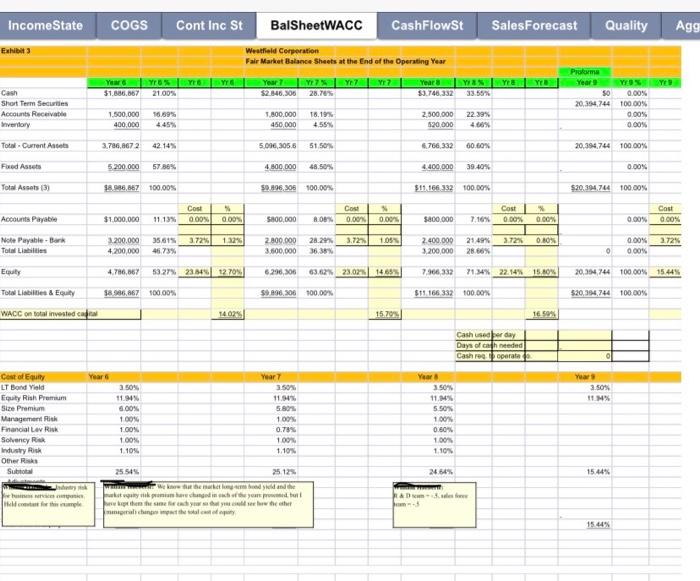
Complete Proforma Year 9. First five pages: income statement, cost of goods sold, contribution format income statement, balance sheet, and cash flow statement. COGS Cont
Complete Proforma Year 9. First five pages: income statement, cost of goods sold, contribution format income statement, balance sheet, and cash flow statement. 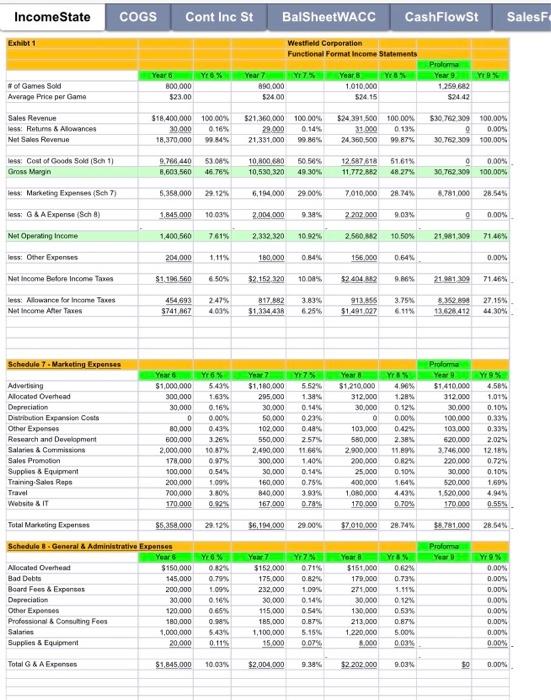
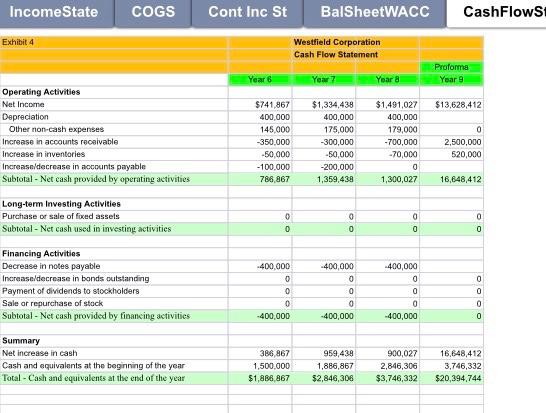
COGS Cont Inc St BalSheetWACC CashFlowSt SalesF Income State Exhibe 1 Westfield Corporation Functional Format Income Statements Yr6% YO Year 800,000 $23.00 #ot Games Sold Average Price per Game Year 890.000 $24.00 Prolom Year 9 WON 1.259.682 $2442 Y Year 1.010.000 52415 100.00% Sales Revenue less: Returns & Allowances Net Sales Revenue $18,400,000 30.000 18,370,000 16% $21,360.000 100.00% 29.000 0.14% 21,331,000 99.86% $24 391 500 31000 24.360.500 100.00% 0.13% 99.87% 530 762 309 100.00% o 0.00% 30,762309 100.00% 99.84% 9.766 440 8.603.560 530% 46.78% 10.000 60 10,530,320 50.58% 49.30% 12.587 818 11.772882 51.61% 48.27% 0 30,762 300 0.00% 100.00% Inse: Cost of Goods Sold Sch 1) Gross Margin - Marketing Expenses (Sch7) less: G&A Expense Sch) 5.358.000 29.12% 6,194.000 29.00% 7 010,000 28.74% 8.781.000 28.54% 1 845 000 10.03% 2004 000 9.38% 2 202.000 9.03% 0 0.00% Net Operating Income 1,400,560 7.619 2,332,320 10 92% 2.560,862 10.50% 21.981209 71.46% less: Other Expenses 204.000 1,11% 180.000 0.846 156000 0.54% 0.00% Net Income Before Income Taxes $1,198 560 650% 32.152.320 10.00% 52404 9.86% 21 19 71 46% 247% less: Allowance for Income Taxes Net Income After Trees 454,693 $741 167 4.09% 817.882 $1,33443 3.83% 6.25% 913 ASS 51.491 027 3.75% 6.11% 3352 13.628 412 27.15% 4430% Schedule 7 - Marketing Expenses 76% 5.43% 1.63% 0.16% 0.00% 0.43% Years $1,000,000 300,000 30,000 0 80,000 600,000 2,000,000 178,000 100,000 200,000 700,000 170 000 Advertising Allocated Overhead Depreciation Distribution Expansion Costs Other Expenses Research and Development Salaries & Commissions Sales Promotion Supplies & Equipment Training Sales Repo Travel Website & IT 3.26% Year 7 $1,180.000 295.000 30,000 50.000 102.000 550,000 2.490.000 300.000 30.000 160.000 840.000 167 000 Y7% 5.52% 1.38% 0.14% 0.23% 0.48% 2.57% 11.68% 1 40% 0.14% 0.75% 3.93% 0.78% Year 8 $1,210.000 312.000 30.000 0 103.000 580,000 2.900,000 200.000 25.000 400.000 1.000.000 170.000 SY 4.96% 1.28% 0.12% 0.00% 0.42% 2.38% 11.89% 0.82% 0.10% 1,64% 443% 0.70% Proforma YewY9% $1.410.000 4.58% 312 000 1,01% 30.000 0.10 100.000 0.33% 103.000 0,33% 620.000 2.02% 3.746.000 12.18% 220.000 0.72% 30 000 0.10% 520.000 1,69% 1.520.000 4.96% 170 000 0.55% 10.87% 0.97% 0.54% 1.09% 3.80% 0.92 Total Marketing Expantes $5.358.000 29.12% $6.194.000 29.00% $7.010.000 28.74% $8.781.000 28.54% Proforma Schedule 3. General & Administrative Expenses Year Allocated Overhead $150 000 Bad Debts 145,000 Board Fees & Expenses 200,000 Depreciation 30,000 Other Expono 120,000 Professional & Consulting Fees 180,000 Salaries 1,000,000 Supplies & Equipment 2000 Y 0.82% 0.79% 100% 0.96% 0.65% 0.98% 6.43% 0.11 Yox7 W7 $152.000 0.71 175,000 0.82% 232.000 1.09% 30.000 0.14% 115,000 054% 185.000 0.87% 1,100,000 5.15% 15 000 0079 Year 8 5151.000 179.000 271.000 30.000 130.000 213.000 1.220,000 000 Yr3% 0.62% 0.73% 1.11% 0.12% 0.53% 0.87% 5.00% 003% Y9% 0.00% 0.00% 0.00% 0.00% 0.00% 0.00% 0.00% 0.00% TotalG & A Expenses $1,845,000 10.00% $2,004 000 9.38% $2 202.000 0.03% $0 0.00% Income State COGS Cont Inc St BalSheetWACC CashFlowSt SalesForecast Quality Ag Westfield Corporation Schedule 1 Cost of Goods Manufactured Proforma Year 9 WON 50 Direct Labor (DLS Dvec Materials Manufacturing Overhead (Sch 21 YoY8% 52365,44024.22% 4.360,000 44.64% 3.041.000 31.14% YYN $2.938,880 27 21% 5.028.500 46.56% 2833.300 20.23% Your way 53.262.848 25.92% 6.050.000 48 14% 3264.770 25.945 Ne bi tafaimaterial- Cost of Goods Manufactured $9 766.440 100.00% $10.600.680 100.00% $12.587618 100.00% 19 $18,370,000 800,000 12.121 $21,331.000 690.000 $24.350.500 1 010 000 11.600 $30,762 300 1.259 612 11609,08977 11.125 Sales Revenue Units Produced Units Produced per DL Employee Per Unit Data Direct Labor perunt Direct Materals per int Manufacturing Overhead per unit $0 0000 $2.9568 $5.4500 33.0013 $3.3021 56.6500 $3.1835 $3 2305 $5.0000 $32324 SO 0000 As a % of Sales Revenue Direct Labor Direct Materiale Manufacturing Overhead Indirect Labor 12,88% 23.73% 16.55% 13.78% 23.57% 13.28% 4.10% 13.39% 24 13 40% 4.76% 0.00% 000% 0.00% 0.00% Proforma Year $0 Schedule 2 Manufacturing Overhead Appraisal Coats Depreciation Indirect Labor Indirect Material nurance Maintenance Miscellaneous Overtime (1.6Xredrale) Prevention Costs Rent Repair Replacements in Field Rework Scrap TOS Us Total Manufacturing Ovutad Year $175,000 340,000 840,000 40,000 130,000 361,000 40.000 230,000 320,000 110.000 15.000 80,000 50,000 100,000 210.000 $3.041,000 Ya 3150.000 340,000 874 000 44 300 137000 164000 20.000 25 000 3:32.000 80 000 20.000 77 000 31.000 104.000 220.000 52.833.300 Yar $127.000 340.000 1.160.000 51.000 142.000 375.000 33.000 114 270 350.000 80.000 16.000 85.000 1.500 115.000 235.000 $3 264.770 0 OOO 50 bylo 19 |110 yaru Proforma Your 2000 Years Schedule 3 Reguler Time Direct Labor (DL) Hours worked in year Average wage rate Average wages per DL employee Plus 28% benefits Total cost per DL employee Number of DL employees Number of the Total direct labor hours Total direct labor coat 2.000 $14.00 $28,000 $7.640 $35,840 56 2.00 132,000 $2.365.440 Yet 2.000 $14.35 $28.700 $8036 336.736 80 2.42 160,000 52.938 80 You 2.000 $14.65 $25.300 $4204 $37504 87 284 174,000 $2.262.840 50 $0 10 105.50 3.29 217.000 SO Income State COGS Cont Inc St BalSheetWACC CashFlowSt SalesForecas Exhibit 2 Westfield Corporation Contribution Format Income Statement Year 6 Yr 8 % $18,370,000 100.00% Year 7 Y7% $21,331,000 100.00% Year 8 Yr8% $24,360,500 100.00% Proforma Year 9 Yr 9 % $30,762,309 100.00% Net Sales Revenue less. Variable Expenses Variable Production Variable Marketing Variable Administrative Total Variable Experises 7,663,440 1,600,000 0 9,263,440 8,554,680 2,090.000 0 10.644.680 10,064,618 2.950,000 g 13,014 618 41.32% 12.11% 0.00% 53.43% 0.00% 0.00% 0.00% 0.00% 0 0 50.43% 49.90% 9,106,560 49.57% 10.688 320 50.10% 11,345,882 48.57% 30,762,309 100.00% Contribution Margin less. Fixed Expenses Fored Production Foved Marketing Fixed Administrative Total Fixed Expenses 2,103,000 3,758,000 1.845,000 7.706,000 2.246,000 4,104,000 2004.000 8,354,000 2,523,000 4,060,000 2,202.000 8,785 000 10.36% 16.67% 9.04% 3606% 0.00% 0.00% 0.00% 0.00% 41.95% 39.16% SO Net Operating Income $1,400,560 7.62% $2.332 320 10.93% $2,560.882 10.51% $30,762,309 100.00% Income State COGS Cont Inc St BalSheetWACC CashFlowSt SalesForecast Quality Agg Exhibit Westfield Corporation Fair Market Balance Sheets at the End of the Operating Year YI Years Yos 51.880.667 21.00% Year Y YY17 $2.146.306 28.70% YEN 33.56% Yea $3.746.332 Cash Short Term Securities Accounts Receivable Invertory Prome WE 50 0.00% 20.354.744 100.00% 0.00% 0.00% 10.59% 18.19% 22.39% 1.500.000 400,000 1.800.000 450,000 2,500,000 520 000 4.66% Total - Current Aset 3.786,0672 42.14% 5.096,305,6 51 50% 6766 332 60.60 20,394.744 100.00% Fred Assets 5 200.000 570% 4.800.000 48.50 4.400.000 39 40% 0.00% Total Assets) $8.996,667 100.00% 50.896 306 100.00% $11.166 332 100.00% $20,394,744 100.00% Cast Cost 0.00 0.00 Cost 0.00 Accounts Payable Cost 0.00% $1.000.000 SA00.000 1113 RO 0.00% $800.000 7.16% 0.00 0.00 0.00% 3.725 3.72 1.05 3.72% 0.10 2.72 Note Payable Total Libes 3.200.000 4.200.000 35.615 46.73% 2.800.000 3.600,000 28.29 36,38% 2.400.000 3.200.000 21 49% 28.66% 0.00% 0.00% 0 4.736,667 53.27% 23.8412.70%. 6.296,00 63.62% 23.02 1465 7.366 332 71.34% 22.14% 15 RON 20,354,744 100.00% 15.445 Tot L & Equity $8.986,867 100.00% $9.896,306 100.00% $15.166.332 100.00% $20,394.744 10000% WACC on total invested ca 140251 15.70 16.50 Cash seper day Days of the needed Cash reoperate Yeard Yuas 3.50% 11% Cost of LT Bond Yield Equity Rish Premium Size Premium Management Rik Financial Lav Risk Solvency Risk Industry Other Re Sutto 350% 11.94% 0.00% 100% 1.00% 100% 1.104 Year 3.50% 11.95 5.80 100 0.78% 100% 1.109 Year 3.50% 11.MX 5.50 100% 0.60% 100% 1.10% 25.12 24.6% 15.44% 25.545 Bentong Bed and the ay magicofyw we then they were al change the way 15.44% Income State COGS Cont Inc St BalSheetWACC CashFlows Exhibit 4 Westfield Corporation Cash Flow Statement Proforma Year 9 Year 6 Year 7 Year $13,628,412 Operating Activities Net Income Depreciation Other non-cash expenses Increase in accounts receivable Increase in inventories Increase decrease in accounts payable Subtotal - Net cash provided by operating activities $741,867 400.000 145.000 -350.000 -50,000 - 100.000 786,867 $1,334,438 400,000 175,000 -300,000 -50,000 -200,000 1,359,438 $1,491,027 400,000 179,000 -700,000 -70,000 0 1,300,027 0 2,500,000 520,000 16,648,412 Long-term Investing Activities Purchase or sale of fixed assets Subtotal - Net cash used in investing activities 0 .. 0 0 0 0 0 0 -400,000 0 0 Financing Activities Decrease in notes payable Increase decrease in bonds outstanding Payment of dividends to stockholders Sale or repurchase of stock Subtotal - Net cash provided by financing activities -400,000 0 0 0 -400,000 0 400,000 0 0 0 -400,000 0 0 0 -400,000 0 Summary Net increase in cash Cash and equivalents at the beginning of the year Total - Cash and equivalents at the end of the year 386,867 1,500,000 $1,886,867 959,438 1,886,867 $2,846,306 900,027 2,846,306 $3,746,332 16,648,412 3,746,332 $20,394,744 Step by Step Solution
There are 3 Steps involved in it
Step: 1

Get Instant Access to Expert-Tailored Solutions
See step-by-step solutions with expert insights and AI powered tools for academic success
Step: 2

Step: 3
Ace Your Homework with AI
Get the answers you need in no time with our AI-driven, step-by-step assistance
Get Started
Managerial Accounting
Authors: John J. Wild, Ken W. Shaw
2010 Edition
9789813155497, 73379581, 9813155493, 978-0073379586