Complete the Competitive Profile Matrix for Hershey Company Case study (located at the end of Chapter 1) using the CPM template located following these instructions.
(THANK YOU SO MUCH IN ADVANCE!)
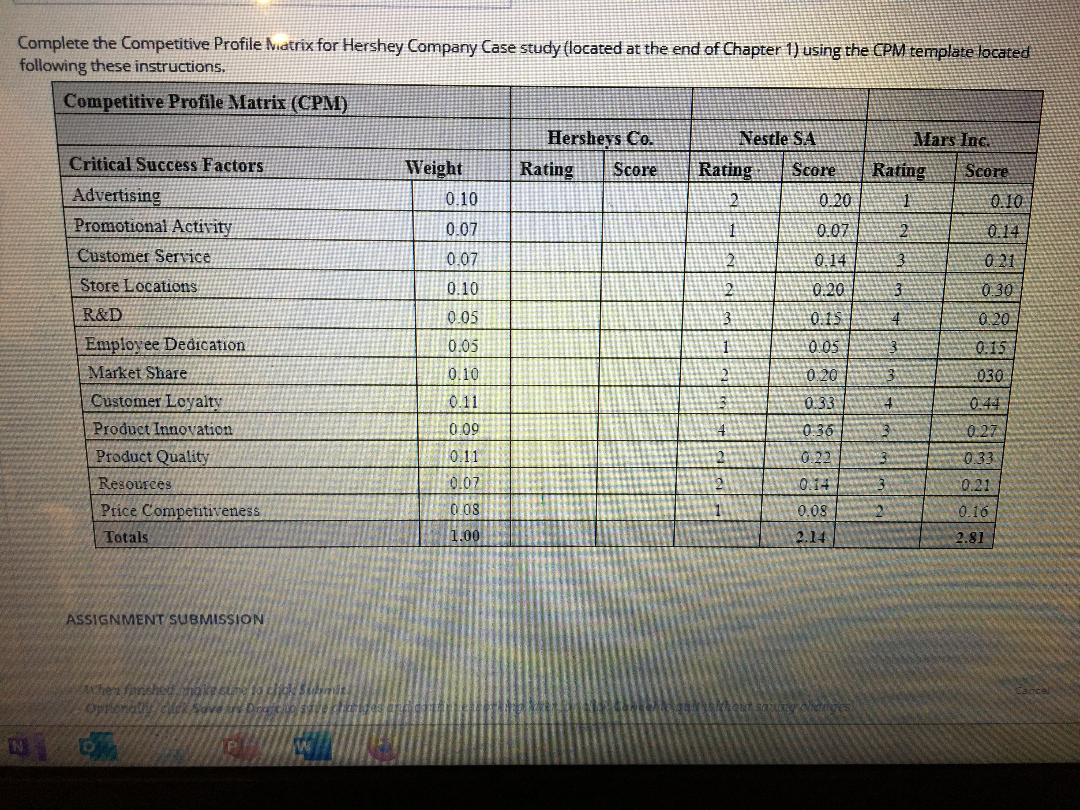
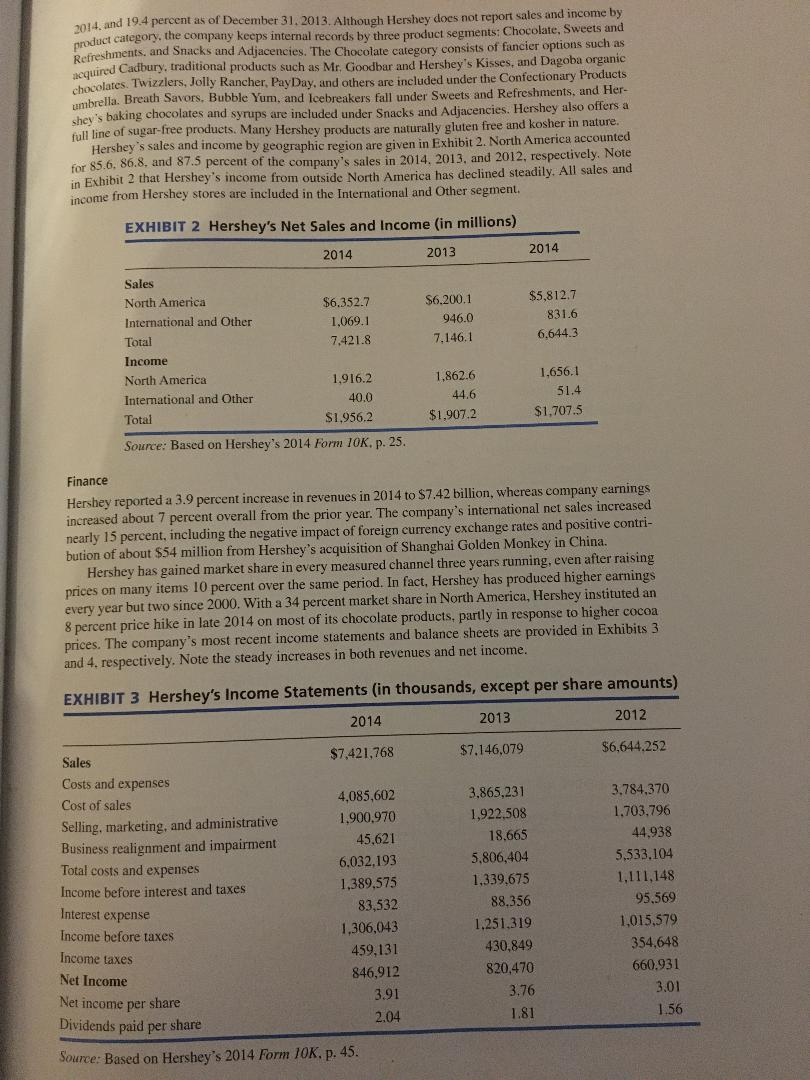
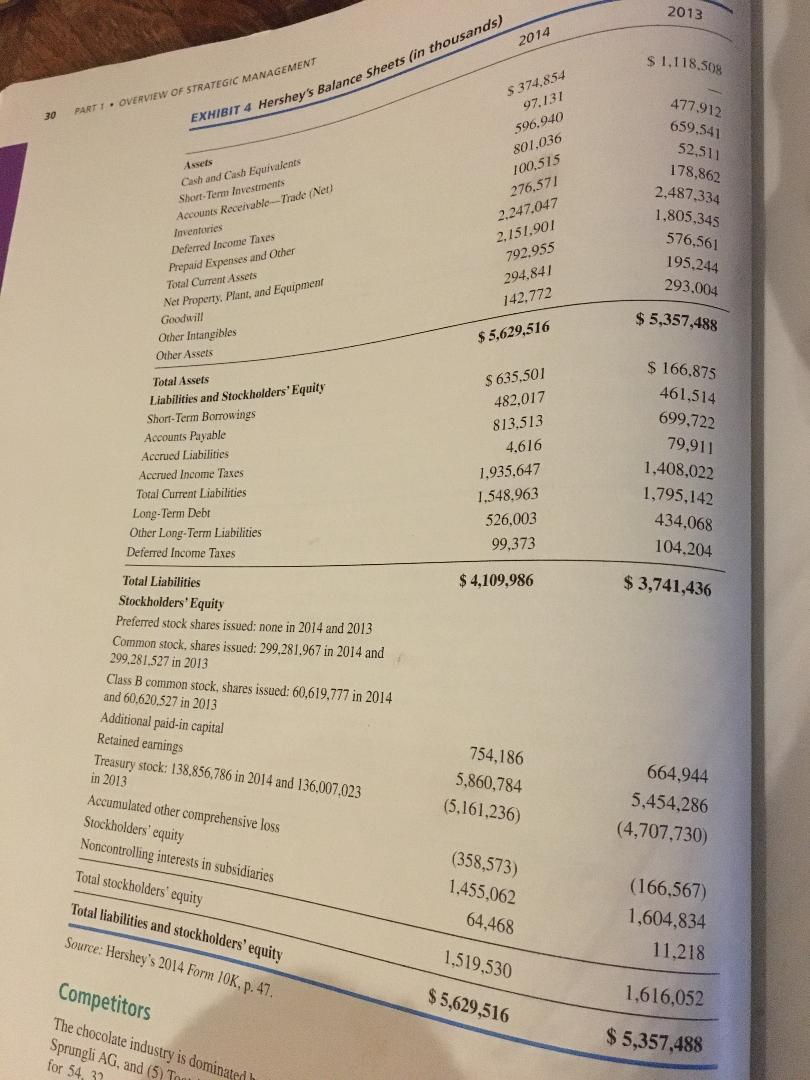
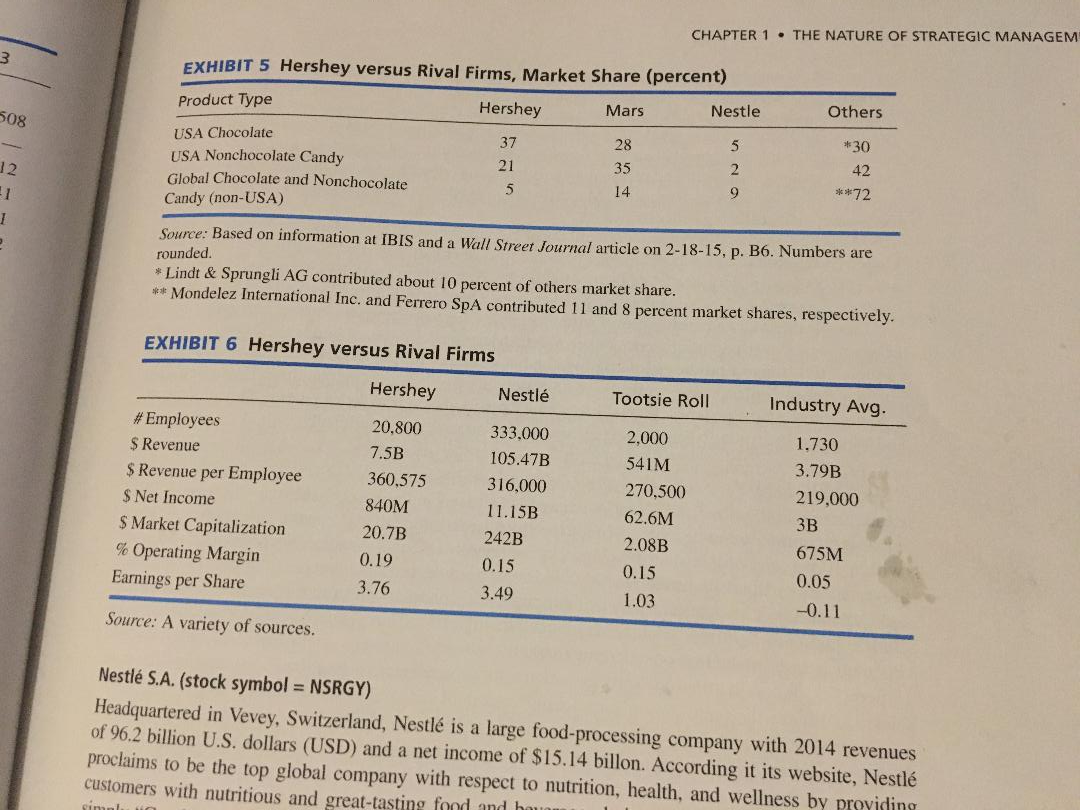
Rating 2 0.20 Complete the Competitive Profile Matrix for Hershey Company Case study (located at the end of Chapter 1) using the CPM template located following these instructions. Competitive Profile Matrix (CPM) Hersheys Co. Nestle SA Mars Inc. Critical Success Factors Weight Score Rating Score Rating Score Advertising 0.10 1 0.10 Promotional Activity 0.07 1 0.07 0.14 Customer Service 0.07 2 0.14 3 Store Locations 0.10 2 0.20 3 0.30 R&D 0.05 3 4 0,20 Employee Dedication 0.05 1 0.05 0.15 Market Share 0.10 0.20 030 Customer Loyalty 0.11 0.33 0.44 Product Innovation 0.09 0.36 0.27 Product Quality 0.11 0.22 0.33 Resources 0.02 0.14 Price Competitiveness 008 0.03 0.16 Totals 1.00 2.14 2.81 0.21 ASSIGNMENT SUBMISSION heunished 2014. and 19.4 percent as of December 31, 2013. Although Hershey does not report sales and income by product category, the company keeps internal records by three product segments: Chocolate, Sweets and Refreshments, and Snacks and Adjacencies. The Chocolate category consists of fancier options such as acquired Cadbury, traditional products such as Mr. Goodbar and Hershey's Kisses, and Dagoba organic chocolates. Twizzlers, Jolly Rancher, PayDay, and others are included under the Confectionary Products shey's baking chocolates and syrups are included under Snacks and Adjacencies. Hershey also offers a full line of sugar-free products. Many Hershey products are naturally gluten free and kosher in nature. Hershey's sales and income by geographic region are given in Exhibit 2. North America accounted for 85.6, 86.8, and 87.5 percent of the company's sales in 2014. 2013, and 2012, respectively. Note in Exhibit 2 that Hershey's income from outside North America has declined steadily. All sales and income from Hershey stores are included in the International and Other segment EXHIBIT 2 Hershey's Net Sales and Income (in millions) 2014 2013 2014 $6.352.7 1.069.1 7.421.8 $6.200.1 946.0 7.146.1 $5,812.7 831.6 6,6443 Sales North America International and Other Total Income North America International and Other Total 1,916.2 40.0 $1.956.2 1.862.6 44.6 $1,907.2 1,656.1 51.4 $1.707.5 Source: Based on Hershey's 2014 Form 10K. p. 25. Finance Hershey reported a 3.9 percent increase in revenues in 2014 to $7.42 billion, whereas company earnings increased about 7 percent overall from the prior year. The company's international net sales increased nearly 15 percent, including the negative impact of foreign currency exchange rates and positive contri- bution of about $54 million from Hershey's acquisition of Shanghai Golden Monkey in China. Hershey has gained market share in every measured channel three years running, even after raising prices on many items 10 percent over the same period. In fact, Hershey has produced higher earnings every year but two since 2000. With a 34 percent market share in North America, Hershey instituted an 8 percent price hike in late 2014 on most of its chocolate products, partly in response to higher cocoa prices. The company's most recent income statements and balance sheets are provided in Exhibits 3 and 4. respectively. Note the steady increases in both revenues and net income. EXHIBIT 3 Hershey's Income Statements (in thousands, except per share amounts) 2014 2013 2012 $7.146.079 $6,644.252 3.865.231 1,922,508 18.665 3.784,370 1.703.796 44.938 5.533.104 1,111,148 95,569 Sales $7,421.768 Costs and expenses Cost of sales 4,085,602 Selling, marketing, and administrative 1,900,970 Business realignment and impairment 45.621 Total costs and expenses 6.032,193 Income before interest and taxes 1.389.575 Interest expense 83,532 Income before taxes 1,306,043 459.131 846,912 Net income per share 3.91 Dividends paid per share 2.04 Source: Based on Hershey's 2014 Form 10K. p. 45. 5.806,404 1,339,675 88,356 1.251,319 430,849 820,470 3.76 1.81 Income taxes Net Income 1,015,579 354.648 660.931 3.01 1.56 EXHIBIT 4 Hershey's Balance Sheets (in thousands) 2013 2014 $ 1.118.508 30 PARTI. OVERVIEW OF STRATEGIC MANAGEMENT $ 374,854 97.131 596.940 801,036 100.515 276.571 2.247.047 2.151.901 477.912 659.541 52,511 178,862 Asses Cash and Cush Equivalents Short Term Investments Accounts Recenable-Trade (Nen imentaries Deferred Income Taxes Prepaid Expenses and Other Total Current Assets Ner Property. Plant, and Equipment 2.487,334 1,805,345 576,561 195.244 293.004 792.955 294,841 142.772 $5,357,488 Goodwill Other Intangibles Other Assets $ 5,629,516 $ 635,501 482,017 813,513 4,616 Total Assets Liabilities and Stockholders' Equity Short-Term Borrowings Accounts Payable Accrued Liabilities Accrued Income Taxes Total Current Liabilities Long-Term Debt Other Long-Term Liabilities Deferred Income Taxes $ 166,875 461,514 699,722 79,911 1,408,022 1,795,142 434.068 104.204 1.935.647 1.548.963 526,003 99.373 $ 4,109,986 $ 3,741,436 Total Liabilities Stockholders'Equity Preferred stock shares issued: none in 2014 and 2013 Common stock, shares issued: 299.281.967 in 2014 and 299.281,527 in 2013 Class B common stock, shares issued: 60,619,777 in 2014 and 60.620,527 in 2013 Additional paid-in capital Retained earnings Treasury stock: 138.856,786 in 2014 and 136.007.023 in 2013 Accumulated other comprehensive loss Stockholders' equity Noncontrolling interests in subsidiaries 754,186 5,860,784 (5.161,236) 664.944 5,454,286 (4,707,730) Total stockholders' equity (358,573) 1,455,062 64,468 Total liabilities and stockholders' equity (166,567) 1,604,834 11.218 Source: Hershey's 2014 Form 10K, p.47. 1,519,530 $5,629,516 1,616,052 Competitors The chocolate industry is dominated Sprungli AG, and (5) To for 54 32 $5,357,488 CHAPTER 1 . THE NATURE OF STRATEGIC MANAGEM 3 EXHIBIT 5 Hershey versus Rival Firms, Market Share (percent) Product Type 508 Hershey Mars Nestle Others 37 5 USA Chocolate USA Nonchocolate Candy Global Chocolate and Nonchocolate Candy (non-USA) *30 42 21 28 35 14 12 1 2 5 9 **72 Source: Based on information at IBIS and a Wall Street Journal article on 2-18-15, p. B6. Numbers are rounded * Lindt & Sprungli AG contributed about 10 percent of others market share. ** Mondelez International Inc. and Ferrero SpA contributed 11 and 8 percent market shares, respectively. EXHIBIT 6 Hershey versus Rival Firms Hershey Nestl Tootsie Roll Industry Avg. # Employees $ Revenue $ Revenue per Employee $ Net Income $ Market Capitalization % Operating Margin Earnings per Share 20.800 7.5B 360,575 840M 20.7B 0.19 333,000 105.47B 316,000 11.15B 242B 0.15 3.49 2.000 541M 270.500 62.6M 2.08B 0.15 1.03 1.730 3.79B 219.000 3B 675M 0.05 -0.11 3.76 Source: A variety of sources. Nestl S.A. (stock symbol = NSRGY) Headquartered in Vevey, Switzerland, Nestl is a large food-processing company with 2014 revenues of 96.2 billion U.S. dollars (USD) and a net income of $15.14 billon. According it its website, Nestl proclaims to be the top global company with respect to nutrition, health, and wellness by providing customers with nutritious and great-tasting food and simulia Rating 2 0.20 Complete the Competitive Profile Matrix for Hershey Company Case study (located at the end of Chapter 1) using the CPM template located following these instructions. Competitive Profile Matrix (CPM) Hersheys Co. Nestle SA Mars Inc. Critical Success Factors Weight Score Rating Score Rating Score Advertising 0.10 1 0.10 Promotional Activity 0.07 1 0.07 0.14 Customer Service 0.07 2 0.14 3 Store Locations 0.10 2 0.20 3 0.30 R&D 0.05 3 4 0,20 Employee Dedication 0.05 1 0.05 0.15 Market Share 0.10 0.20 030 Customer Loyalty 0.11 0.33 0.44 Product Innovation 0.09 0.36 0.27 Product Quality 0.11 0.22 0.33 Resources 0.02 0.14 Price Competitiveness 008 0.03 0.16 Totals 1.00 2.14 2.81 0.21 ASSIGNMENT SUBMISSION heunished 2014. and 19.4 percent as of December 31, 2013. Although Hershey does not report sales and income by product category, the company keeps internal records by three product segments: Chocolate, Sweets and Refreshments, and Snacks and Adjacencies. The Chocolate category consists of fancier options such as acquired Cadbury, traditional products such as Mr. Goodbar and Hershey's Kisses, and Dagoba organic chocolates. Twizzlers, Jolly Rancher, PayDay, and others are included under the Confectionary Products shey's baking chocolates and syrups are included under Snacks and Adjacencies. Hershey also offers a full line of sugar-free products. Many Hershey products are naturally gluten free and kosher in nature. Hershey's sales and income by geographic region are given in Exhibit 2. North America accounted for 85.6, 86.8, and 87.5 percent of the company's sales in 2014. 2013, and 2012, respectively. Note in Exhibit 2 that Hershey's income from outside North America has declined steadily. All sales and income from Hershey stores are included in the International and Other segment EXHIBIT 2 Hershey's Net Sales and Income (in millions) 2014 2013 2014 $6.352.7 1.069.1 7.421.8 $6.200.1 946.0 7.146.1 $5,812.7 831.6 6,6443 Sales North America International and Other Total Income North America International and Other Total 1,916.2 40.0 $1.956.2 1.862.6 44.6 $1,907.2 1,656.1 51.4 $1.707.5 Source: Based on Hershey's 2014 Form 10K. p. 25. Finance Hershey reported a 3.9 percent increase in revenues in 2014 to $7.42 billion, whereas company earnings increased about 7 percent overall from the prior year. The company's international net sales increased nearly 15 percent, including the negative impact of foreign currency exchange rates and positive contri- bution of about $54 million from Hershey's acquisition of Shanghai Golden Monkey in China. Hershey has gained market share in every measured channel three years running, even after raising prices on many items 10 percent over the same period. In fact, Hershey has produced higher earnings every year but two since 2000. With a 34 percent market share in North America, Hershey instituted an 8 percent price hike in late 2014 on most of its chocolate products, partly in response to higher cocoa prices. The company's most recent income statements and balance sheets are provided in Exhibits 3 and 4. respectively. Note the steady increases in both revenues and net income. EXHIBIT 3 Hershey's Income Statements (in thousands, except per share amounts) 2014 2013 2012 $7.146.079 $6,644.252 3.865.231 1,922,508 18.665 3.784,370 1.703.796 44.938 5.533.104 1,111,148 95,569 Sales $7,421.768 Costs and expenses Cost of sales 4,085,602 Selling, marketing, and administrative 1,900,970 Business realignment and impairment 45.621 Total costs and expenses 6.032,193 Income before interest and taxes 1.389.575 Interest expense 83,532 Income before taxes 1,306,043 459.131 846,912 Net income per share 3.91 Dividends paid per share 2.04 Source: Based on Hershey's 2014 Form 10K. p. 45. 5.806,404 1,339,675 88,356 1.251,319 430,849 820,470 3.76 1.81 Income taxes Net Income 1,015,579 354.648 660.931 3.01 1.56 EXHIBIT 4 Hershey's Balance Sheets (in thousands) 2013 2014 $ 1.118.508 30 PARTI. OVERVIEW OF STRATEGIC MANAGEMENT $ 374,854 97.131 596.940 801,036 100.515 276.571 2.247.047 2.151.901 477.912 659.541 52,511 178,862 Asses Cash and Cush Equivalents Short Term Investments Accounts Recenable-Trade (Nen imentaries Deferred Income Taxes Prepaid Expenses and Other Total Current Assets Ner Property. Plant, and Equipment 2.487,334 1,805,345 576,561 195.244 293.004 792.955 294,841 142.772 $5,357,488 Goodwill Other Intangibles Other Assets $ 5,629,516 $ 635,501 482,017 813,513 4,616 Total Assets Liabilities and Stockholders' Equity Short-Term Borrowings Accounts Payable Accrued Liabilities Accrued Income Taxes Total Current Liabilities Long-Term Debt Other Long-Term Liabilities Deferred Income Taxes $ 166,875 461,514 699,722 79,911 1,408,022 1,795,142 434.068 104.204 1.935.647 1.548.963 526,003 99.373 $ 4,109,986 $ 3,741,436 Total Liabilities Stockholders'Equity Preferred stock shares issued: none in 2014 and 2013 Common stock, shares issued: 299.281.967 in 2014 and 299.281,527 in 2013 Class B common stock, shares issued: 60,619,777 in 2014 and 60.620,527 in 2013 Additional paid-in capital Retained earnings Treasury stock: 138.856,786 in 2014 and 136.007.023 in 2013 Accumulated other comprehensive loss Stockholders' equity Noncontrolling interests in subsidiaries 754,186 5,860,784 (5.161,236) 664.944 5,454,286 (4,707,730) Total stockholders' equity (358,573) 1,455,062 64,468 Total liabilities and stockholders' equity (166,567) 1,604,834 11.218 Source: Hershey's 2014 Form 10K, p.47. 1,519,530 $5,629,516 1,616,052 Competitors The chocolate industry is dominated Sprungli AG, and (5) To for 54 32 $5,357,488 CHAPTER 1 . THE NATURE OF STRATEGIC MANAGEM 3 EXHIBIT 5 Hershey versus Rival Firms, Market Share (percent) Product Type 508 Hershey Mars Nestle Others 37 5 USA Chocolate USA Nonchocolate Candy Global Chocolate and Nonchocolate Candy (non-USA) *30 42 21 28 35 14 12 1 2 5 9 **72 Source: Based on information at IBIS and a Wall Street Journal article on 2-18-15, p. B6. Numbers are rounded * Lindt & Sprungli AG contributed about 10 percent of others market share. ** Mondelez International Inc. and Ferrero SpA contributed 11 and 8 percent market shares, respectively. EXHIBIT 6 Hershey versus Rival Firms Hershey Nestl Tootsie Roll Industry Avg. # Employees $ Revenue $ Revenue per Employee $ Net Income $ Market Capitalization % Operating Margin Earnings per Share 20.800 7.5B 360,575 840M 20.7B 0.19 333,000 105.47B 316,000 11.15B 242B 0.15 3.49 2.000 541M 270.500 62.6M 2.08B 0.15 1.03 1.730 3.79B 219.000 3B 675M 0.05 -0.11 3.76 Source: A variety of sources. Nestl S.A. (stock symbol = NSRGY) Headquartered in Vevey, Switzerland, Nestl is a large food-processing company with 2014 revenues of 96.2 billion U.S. dollars (USD) and a net income of $15.14 billon. According it its website, Nestl proclaims to be the top global company with respect to nutrition, health, and wellness by providing customers with nutritious and great-tasting food and simulia