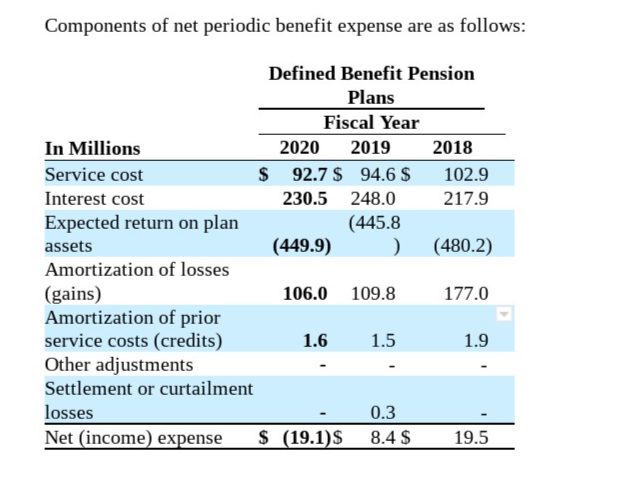
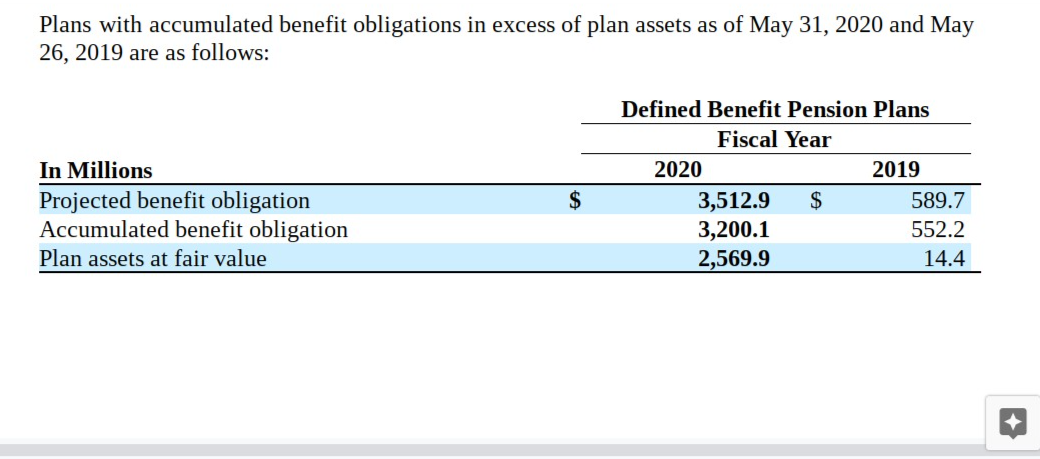
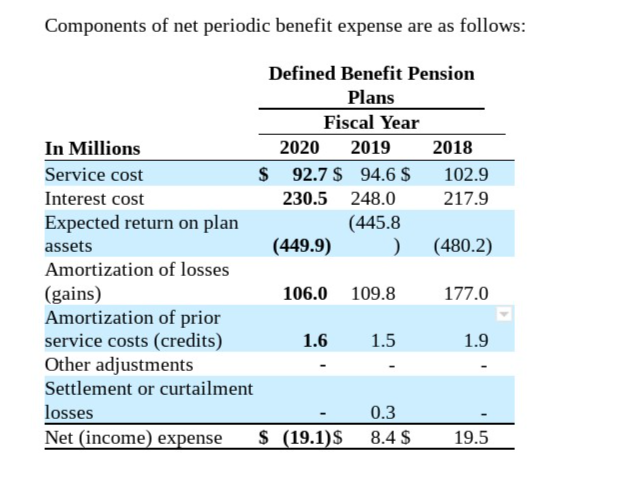
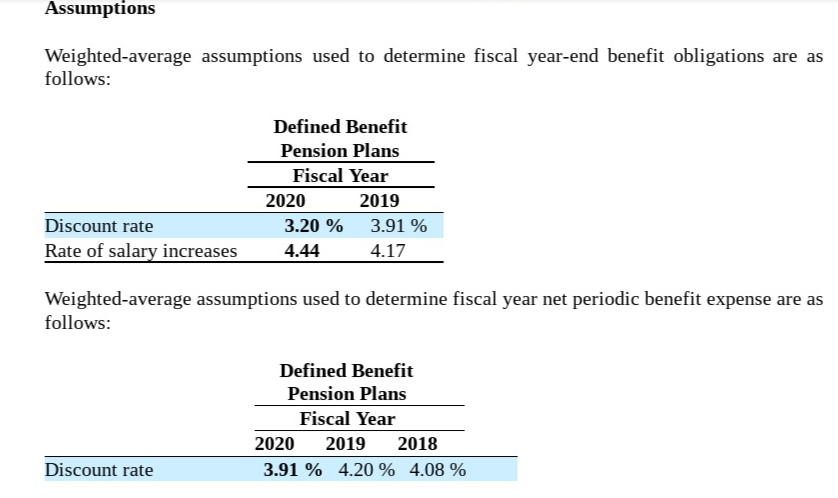
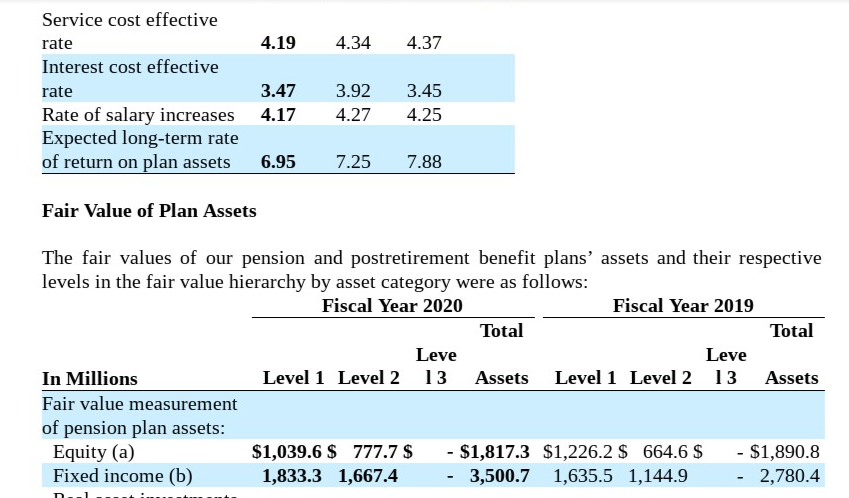
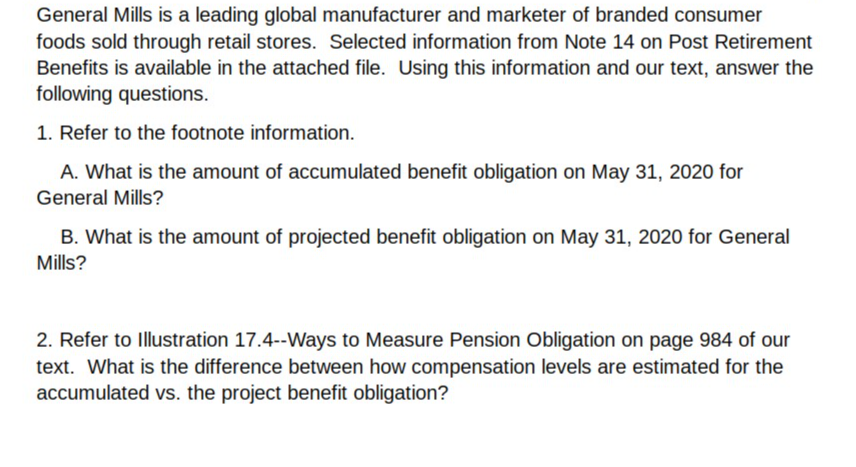
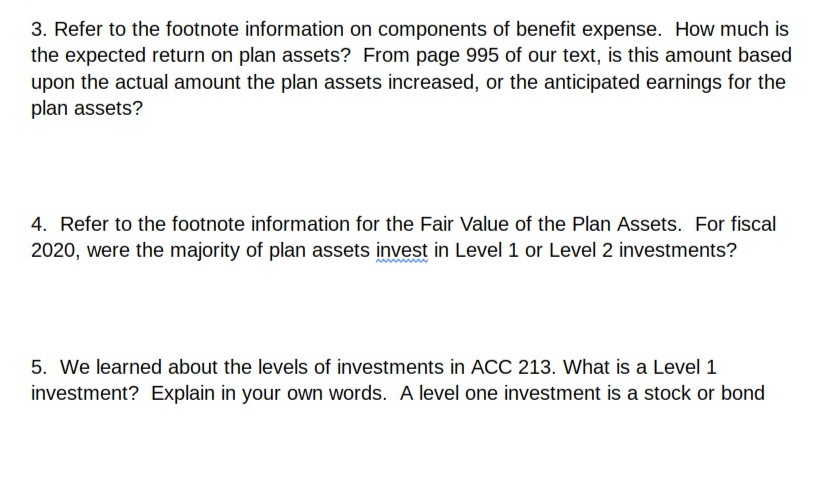
Components of net periodic benefit expense are as follows: Defined Benefit Pension Plans Fiscal Year In Millions 2020 2019 2018 Service cost $ 92.7 $ 94.6 $ 102.9 Interest cost 230.5 248.0 217.9 Expected return on plan (445.8 assets (449.9) ) (480.2) Amortization of losses (gains) 106.0 109.8 177.0 Amortization of prior service costs (credits) 1.6 1.5 1.9 Other adjustments Settlement or curtailment losses 0.3 Net (income) expense $ (19.1)$ 8.4 $ 19.5 Plans with accumulated benefit obligations in excess of plan assets as of May 31, 2020 and May 26, 2019 are as follows: Defined Benefit Pension Plans Fiscal Year 2020 2019 3,512.9 $ 589.7 3,200.1 552.2 2,569.9 14.4 In Millions Projected benefit obligation Accumulated benefit obligation Plan assets at fair value $ Components of net periodic benefit expense are as follows: Defined Benefit Pension Plans Fiscal Year In Millions 2020 2019 2018 Service cost $ 92.7 $ 94.6 $ 102.9 Interest cost 230.5 248.0 217.9 Expected return on plan (445.8 assets (449.9) ) (480.2) Amortization of losses (gains) 106.0 109.8 177.0 Amortization of prior service costs (credits) 1.6 1.5 1.9 Other adjustments Settlement or curtailment losses 0.3 Net (income) expense $ (19.1)$ 8.4 $ 19.5 Assumptions Weighted average assumptions used to determine fiscal year-end benefit obligations are as follows: Defined Benefit Pension Plans Fiscal Year 2020 2019 3.20 % 3.91 % 4.44 4.17 Discount rate Rate of salary increases Weighted average assumptions used to determine fiscal year net periodic benefit expense are as follows: Defined Benefit Pension Plans Fiscal Year 2020 2019 2018 3.91 % 4.20 % 4.08 % Discount rate 4.34 4.37 Service cost effective rate 4.19 Interest cost effective rate 3.47 Rate of salary increases 4.17 Expected long-term rate of return on plan assets 6.95 3.92 4.27 3.45 4.25 7.25 7.88 Fair Value of Plan Assets The fair values of our pension and postretirement benefit plans' assets and their respective levels in the fair value hierarchy by asset category were as follows: Fiscal Year 2020 Fiscal Year 2019 Total Total Leve Leve In Millions Level 1 Level 2 13 Assets Level 1 Level 2 13 Assets Fair value measurement of pension plan assets: Equity (a) $1,039.6 $ 777.7 $ - $1,817.3 $1,226.2 $ 664.6 $ - $1,890.8 Fixed income (b) 1,833.3 1,667.4 3,500.7 1,635.5 1,144.9 2,780.4 -- General Mills is a leading global manufacturer and marketer of branded consumer foods sold through retail stores. Selected information from Note 14 on Post Retirement Benefits is available in the attached file. Using this information and our text, answer the following questions. 1. Refer to the footnote information. A. What is the amount of accumulated benefit obligation on May 31, 2020 for General Mills? B. What is the amount of projected benefit obligation on May 31, 2020 for General Mills? 2. Refer to Illustration 17.4--Ways to Measure Pension Obligation on page 984 of our text. What is the difference between how compensation levels are estimated for the accumulated vs. the project benefit obligation? 3. Refer to the footnote information on components of benefit expense. How much is the expected return on plan assets? From page 995 of our text, is this amount based upon the actual amount the plan assets increased, or the anticipated earnings for the plan assets? 4. Refer to the footnote information for the Fair Value of the Plan Assets. For fiscal 2020, were the majority of plan assets invest in Level 1 or Level 2 investments? 5. We learned about the levels of investments in ACC 213. What is a Level 1 investment? Explain in your own words. A level one investment is a stock or bond Components of net periodic benefit expense are as follows: Defined Benefit Pension Plans Fiscal Year In Millions 2020 2019 2018 Service cost $ 92.7 $ 94.6 $ 102.9 Interest cost 230.5 248.0 217.9 Expected return on plan (445.8 assets (449.9) ) (480.2) Amortization of losses (gains) 106.0 109.8 177.0 Amortization of prior service costs (credits) 1.6 1.5 1.9 Other adjustments Settlement or curtailment losses 0.3 Net (income) expense $ (19.1)$ 8.4 $ 19.5 Plans with accumulated benefit obligations in excess of plan assets as of May 31, 2020 and May 26, 2019 are as follows: Defined Benefit Pension Plans Fiscal Year 2020 2019 3,512.9 $ 589.7 3,200.1 552.2 2,569.9 14.4 In Millions Projected benefit obligation Accumulated benefit obligation Plan assets at fair value $ Components of net periodic benefit expense are as follows: Defined Benefit Pension Plans Fiscal Year In Millions 2020 2019 2018 Service cost $ 92.7 $ 94.6 $ 102.9 Interest cost 230.5 248.0 217.9 Expected return on plan (445.8 assets (449.9) ) (480.2) Amortization of losses (gains) 106.0 109.8 177.0 Amortization of prior service costs (credits) 1.6 1.5 1.9 Other adjustments Settlement or curtailment losses 0.3 Net (income) expense $ (19.1)$ 8.4 $ 19.5 Assumptions Weighted average assumptions used to determine fiscal year-end benefit obligations are as follows: Defined Benefit Pension Plans Fiscal Year 2020 2019 3.20 % 3.91 % 4.44 4.17 Discount rate Rate of salary increases Weighted average assumptions used to determine fiscal year net periodic benefit expense are as follows: Defined Benefit Pension Plans Fiscal Year 2020 2019 2018 3.91 % 4.20 % 4.08 % Discount rate 4.34 4.37 Service cost effective rate 4.19 Interest cost effective rate 3.47 Rate of salary increases 4.17 Expected long-term rate of return on plan assets 6.95 3.92 4.27 3.45 4.25 7.25 7.88 Fair Value of Plan Assets The fair values of our pension and postretirement benefit plans' assets and their respective levels in the fair value hierarchy by asset category were as follows: Fiscal Year 2020 Fiscal Year 2019 Total Total Leve Leve In Millions Level 1 Level 2 13 Assets Level 1 Level 2 13 Assets Fair value measurement of pension plan assets: Equity (a) $1,039.6 $ 777.7 $ - $1,817.3 $1,226.2 $ 664.6 $ - $1,890.8 Fixed income (b) 1,833.3 1,667.4 3,500.7 1,635.5 1,144.9 2,780.4 -- General Mills is a leading global manufacturer and marketer of branded consumer foods sold through retail stores. Selected information from Note 14 on Post Retirement Benefits is available in the attached file. Using this information and our text, answer the following questions. 1. Refer to the footnote information. A. What is the amount of accumulated benefit obligation on May 31, 2020 for General Mills? B. What is the amount of projected benefit obligation on May 31, 2020 for General Mills? 2. Refer to Illustration 17.4--Ways to Measure Pension Obligation on page 984 of our text. What is the difference between how compensation levels are estimated for the accumulated vs. the project benefit obligation? 3. Refer to the footnote information on components of benefit expense. How much is the expected return on plan assets? From page 995 of our text, is this amount based upon the actual amount the plan assets increased, or the anticipated earnings for the plan assets? 4. Refer to the footnote information for the Fair Value of the Plan Assets. For fiscal 2020, were the majority of plan assets invest in Level 1 or Level 2 investments? 5. We learned about the levels of investments in ACC 213. What is a Level 1 investment? Explain in your own words. A level one investment is a stock or bond


