Compute the following programming assignment following the instructions given
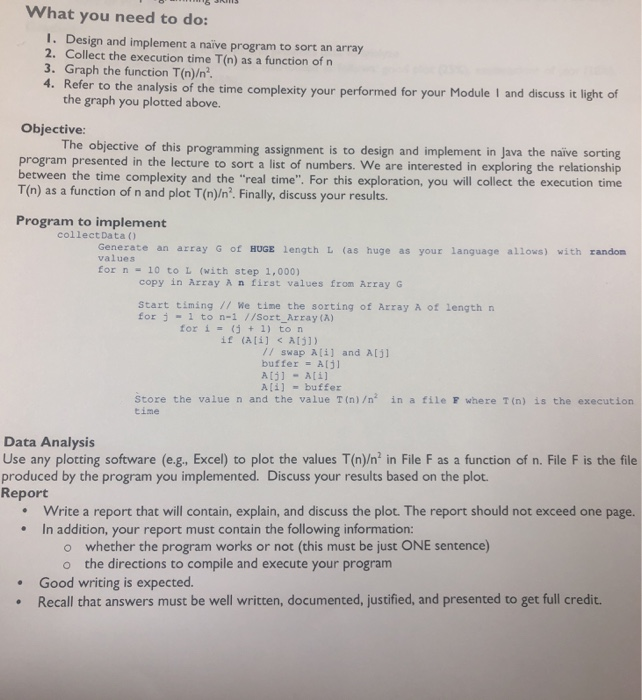
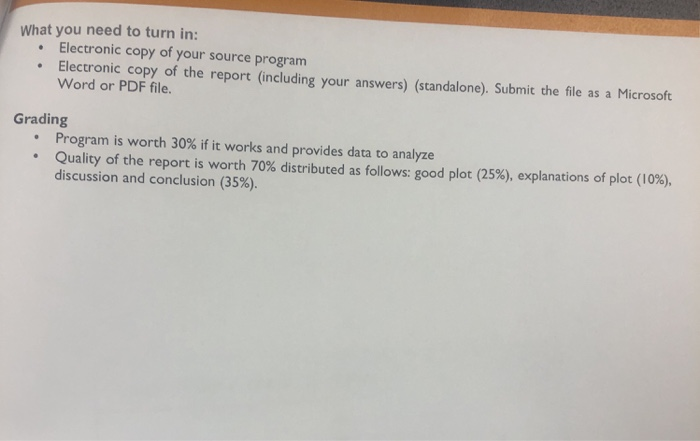
What you need to do: I. Design and implement a naive program to sort an array 2. Collect the execution time T(n) as a function of n 3. Graph the function T(n)2. 4. Refer to the analysis of the time complexity your performed for your Module I and discuss it light of the graph you plotted above. Objective The objective of this programming assignment is to design and implement in Java the naive sorting program presented in the lecture to sort a list of numbers. We are interested in exploring the relationship tween the time complexity and the "real time". For this exploration, you will collect the execution time T(n) as a function of n and plot T(n). Finally, discuss your results. Program to implement collectData () Generate an acray G of HUGE length L (as huge as your language allows) with random values for n 10 to L (with step 1,000) copy in Array A n first values from Array G start timing // We time the sorting of Array A of length n for 1 to n-l //Sort Array (A) for i = (j + 1) ton // swap [i] bufferAj and A[j] A buffer Store the value n and the value T(n) in a file F where T(n) is the execution time Data Analysis Use any plotting software (e.g., Excel) to plot the values T(n)2 in File F as a function of n. File F is the file produced by the program you implemented. Discuss your results based on the plot Report Write a report that will contain, explain, and discuss the plot. The report should not exceed one page. In addition, your report must contain the following information: whether the program works or not (this must be just ONE sentence) the directions to compile and execute your program o o Good writing is expected Recall that answers must be well written, documented, justified, and presented to get full credit. What you need to turn in: Electronic copy of your source program . Electronic copy of the report (including your answers) (standalone),. Submit the file as a Microsoft Word or PDF file Grading Program is worth 30% if it works and provides data to analyze Quality of the report is worth 70% distributed as follows: good plot (25%), explanations of plot (10%), discussion and conclusion (35%)