Answered step by step
Verified Expert Solution
Link Copied!

Question

1 Approved Answer

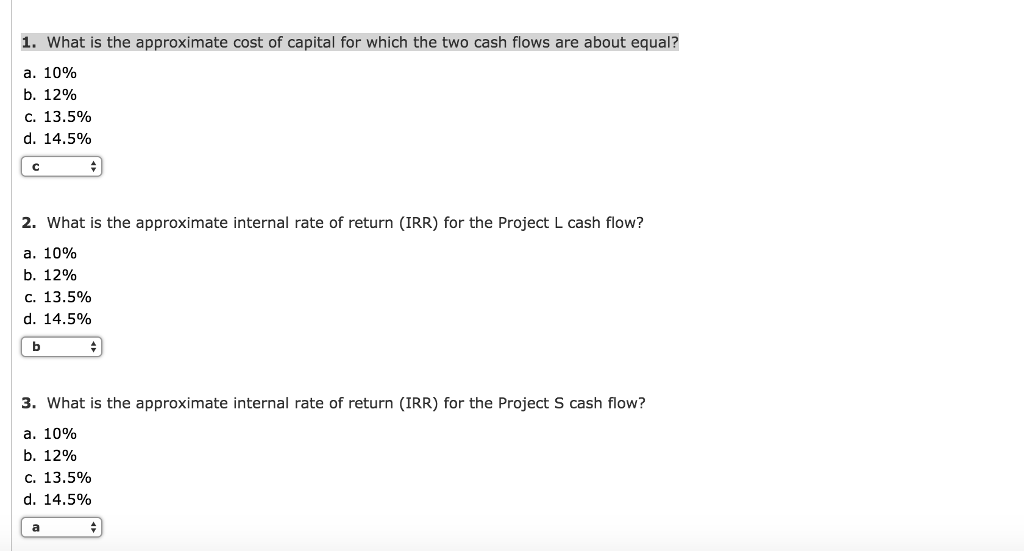
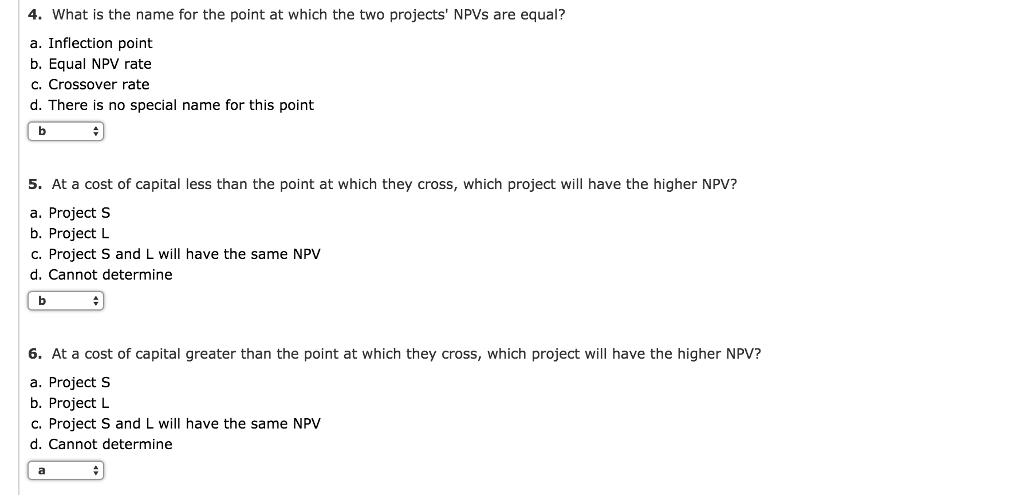
Conceptual Overview: Explore how the timing and size of cash flows affect the net present values of two alternative investments. The blue curve (labeled L)

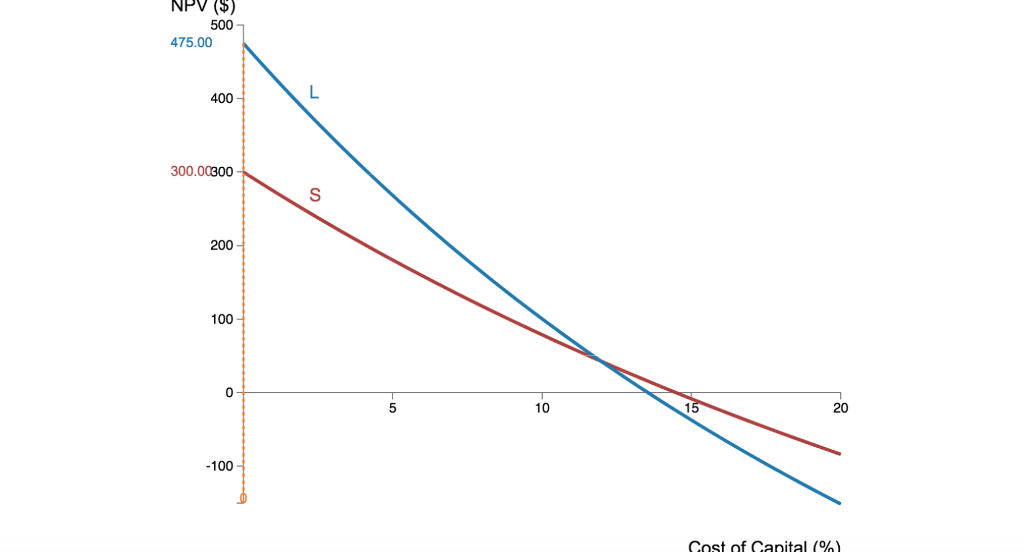
image text in transcribedimage text in transcribedimage text in transcribedimage text in transcribed

Conceptual Overview: Explore how the timing and size of cash flows affect the net present values of two alternative investments. The blue curve (labeled "L") depicts the NPV for a project with larger cash flows later of -$1,000, $100, $300, $400, and $675. The red curve (labeled "S") depicts the NPV for a project with larger cash flows sooner of -$1,000, $500, $400, $300, and $100. Drag on the graph either left or right to change the cost of capital interest rate at which the NPV is evaluated for the two projects. $100 = $300.00 (1+0.0000) N CF $500 Project S: NPV-CF0 + ?????=-$1 ,000 + (140.000 OT + (1+00000 )2 + Project L: NPV-CF0 + ? i??=-$1,000 + (1401000 ( 1-0.0000-?( 1-0.0000 + ( 3000F + (1-04000?+ (1 (1 +0.0000??( 1-0.0000)4 $675$475.00

Step by Step Solution

There are 3 Steps involved in it

Step: 1

blur-text-image

Get Instant Access to Expert-Tailored Solutions

See step-by-step solutions with expert insights and AI powered tools for academic success

Step: 2

blur-text-image_2

Step: 3

blur-text-image_3

Ace Your Homework with AI

Get the answers you need in no time with our AI-driven, step-by-step assistance

Get Started

Students also viewed these Finance questions