Question
Question 2: Wells Fargo: Solar Energy for Los Angeles Branch (A) (Case Study UV6566) If Wells Fargo installs solar panels on even a small fraction
Question 2: Wells Fargo: Solar Energy for Los Angeles Branch (A) (Case Study UV6566)
If Wells Fargo installs solar panels on even a small fraction of its more than 6000 banking branches across the United States, it can become one of the largest and most sustainable energy producers in the country. Sheri Lucas, VP and strategic finance manager at Wells Fargo, led the company's pilot installation in Denver and now is examining the possibility of a similar installation in Los Angeles. The case provides the background for the photovoltaic technology and business of solar panels and describes the base case situation that Lucas faced in 2011.
2.1. What is the value of the project without the incentives over a 12-year horizon? And over 30 years?
2.2. What is the value of the project with the ITC incentive over a 12-year horizon? And over 30 years?
2.3. What is the value of the project with the ITC incentive and the SIP for a 12-year horizon? And over 30 years?
2.4. Should Lucas go ahead with the project?
************
plz use excel to solve these questions
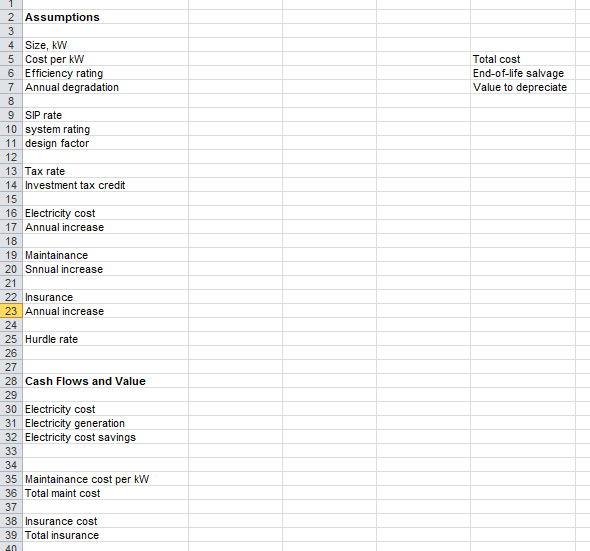
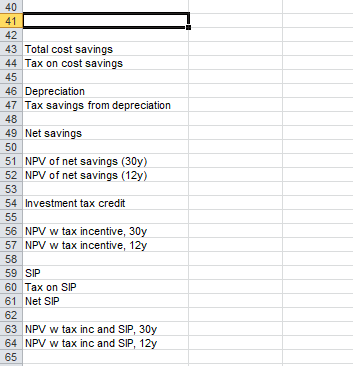
2 Assumptions 4 Size, kW 5 Cost per kW Total cost 6 Efficiency rating End-of-life salvage Annual degradation Value to depreciate SIP rate 10 system rating 11 design factor 12 13 Tax rate 14 Investment tax credit 15 16 Electricity cost 17 Annual increase 18 19 Maintainance 20 Snnual increase 21 22 Insurance Annual increase Hurdle rate Cash Flows and Value Electricity cost Electricity generation Electricity cost savings Maintainance cost per kW Total maint cost Insurance cost Total insurance 43 Total cost savings 44 Tax on cost savings 45 46 Depreciation 47 Tax savings from depreciation 48 Net savings 50 51 NPV of net savings (30y) 52 NPV of net savings (12y) 53 54 Investment tax credit 55 56 NPV w tax incentive, 30y 57 NPV w tax incentive, 12y \begin{tabular}{|l|l} 58 & \\ \hline 59 & SIP \end{tabular} 60 Tax on SIP 61 Net SIP 62 63 NPV w tax inc and SIP, 30y 64 NPV w tax inc and SIP, 12y 65 2 Assumptions 4 Size, kW 5 Cost per kW Total cost 6 Efficiency rating End-of-life salvage Annual degradation Value to depreciate SIP rate 10 system rating 11 design factor 12 13 Tax rate 14 Investment tax credit 15 16 Electricity cost 17 Annual increase 18 19 Maintainance 20 Snnual increase 21 22 Insurance Annual increase Hurdle rate Cash Flows and Value Electricity cost Electricity generation Electricity cost savings Maintainance cost per kW Total maint cost Insurance cost Total insurance 43 Total cost savings 44 Tax on cost savings 45 46 Depreciation 47 Tax savings from depreciation 48 Net savings 50 51 NPV of net savings (30y) 52 NPV of net savings (12y) 53 54 Investment tax credit 55 56 NPV w tax incentive, 30y 57 NPV w tax incentive, 12y \begin{tabular}{|l|l} 58 & \\ \hline 59 & SIP \end{tabular} 60 Tax on SIP 61 Net SIP 62 63 NPV w tax inc and SIP, 30y 64 NPV w tax inc and SIP, 12y 65
Step by Step Solution
There are 3 Steps involved in it
Step: 1
Get Instant Access to Expert-Tailored Solutions
See step-by-step solutions with expert insights and AI powered tools for academic success
Step: 2
Step: 3
Ace Your Homework with AI
Get the answers you need in no time with our AI-driven, step-by-step assistance
Get Started