Answered step by step
Verified Expert Solution
Question
1 Approved Answer
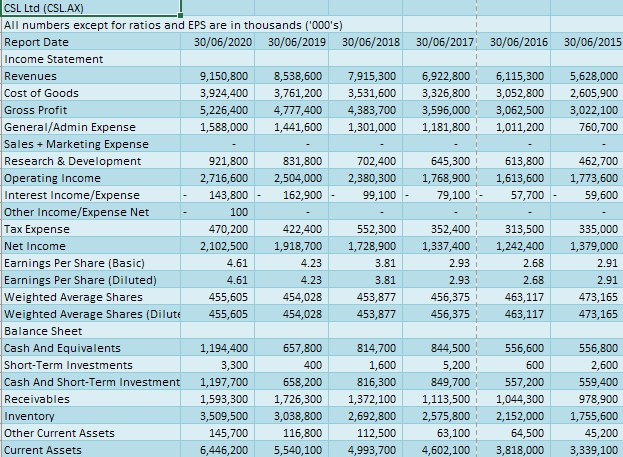
Conduct the following analysis based on data below Horizontal analysis , select one base year 2015 , and calculate dollar
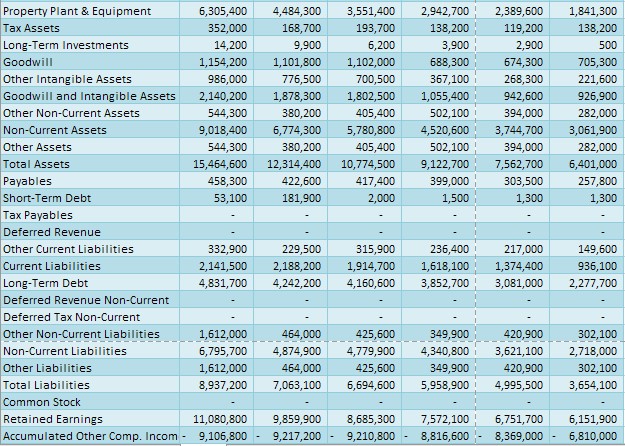
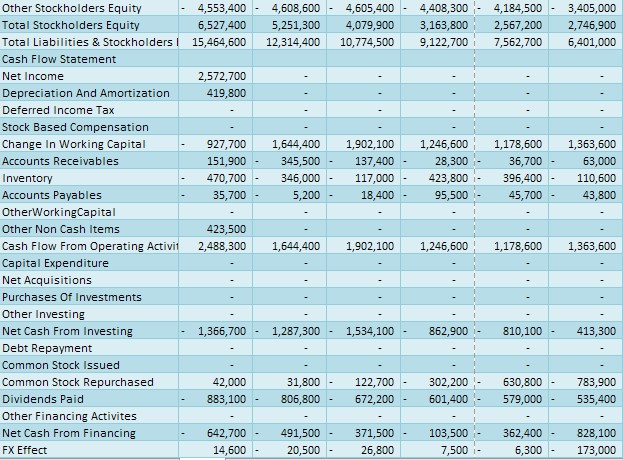
Conduct the following analysis based on data below
· Horizontal analysis, select one base year 2015, and calculate dollar change and percentage change.
· Vertical analysis (Common size analysis)
· Trend analysis, select base year 2015 for trend analysis


CSL Ltd (CSL.AX) All numbers except for ratios and EPS are in thousands ('000's) Report Date 30/06/2020 30/06/2019 30/06/2018 30/06/2017 30/06/2016 30/06/2015 Income Statement Revenues Cost of Goods Gross Profit General/Admin Expense 9,150,800 8,538,600 7,915,300 6,922,800 6,115,300 5,628,000 3,924,400 3,761,200 3,531,600 3,326,800 3,052,800 2,605,900 5,226,400 4,777,400 4,383,700 3,596,000 3,062,500 3,022,100 1,588,000 1,441,600 1,301,000 1,181,800 1,011,200 760,700 Sales + Marketing Expense Research & Development 921,800 Operating Income 2,716,600 831,800 2,504,000 702,400 645,300 613,800 462,700 2,380,300 1,768,900 1,613,600 1,773,600 Interest Income/Expense 143,800 162,900 99,100 79,100 57,700 59,600 Other Income/Expense Net Tax Expense Net Income 100 470,200 422,400 552,300 2,102,500 1,918,700 1,728,900 352,400 1,337,400 313,500 1,242,400 335,000 1,379,000 Earnings Per Share (Basic) 4.61 4.23 3.81 2.93 2.68 2.91 Earnings Per Share (Diluted) 4.61 4.23 3.81 2.93 2.68 2.91 Weighted Average Shares 455,605 454,028 453,877 456,375 463,117 473,165 Weighted Average Shares (Dilute 455,605 454,028 453,877 456,375 463,117 473,165 Balance Sheet Cash And Equivalents 1,194,400 657,800 814,700 844,500 556,600 556,800 Short-Term Investments 3,300 400 1,600 5,200 600 2,600 Cash And Short-Term Investment 1,197,700 658,200 816,300 849,700 557,200 559,400 Receivables 1,593,300 1,726,300 1,372,100 1,113,500 1,044,300 978,900 Inventory 3,509,500 3,038,800 2,692,800 2,575,800 2,152,000 1,755,600 Other Current Assets 145,700 116,800 Current Assets 6,446,200 5,540,100 112,500 4,993,700 63,100 4,602,100 64,500 3,818,000 45,200 3,339,100
Step by Step Solution
There are 3 Steps involved in it
Step: 1

Get Instant Access to Expert-Tailored Solutions
See step-by-step solutions with expert insights and AI powered tools for academic success
Step: 2

Step: 3

Ace Your Homework with AI
Get the answers you need in no time with our AI-driven, step-by-step assistance
Get Started


