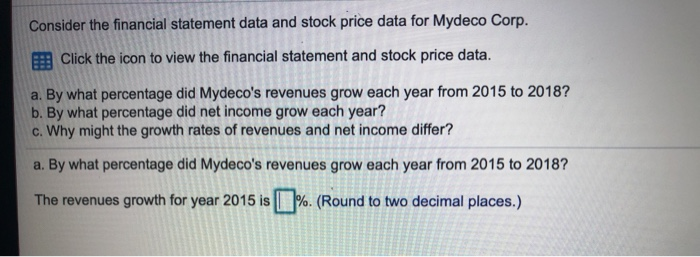
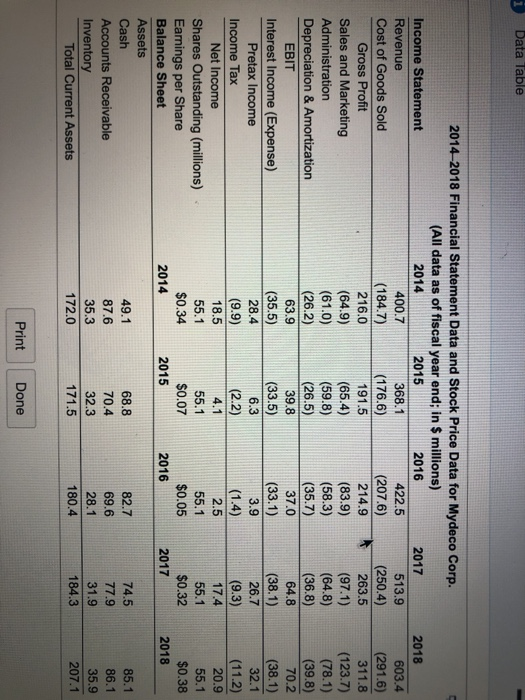
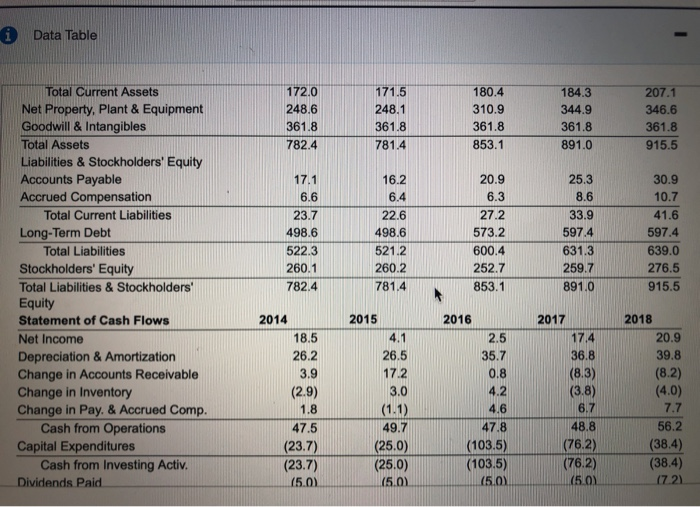
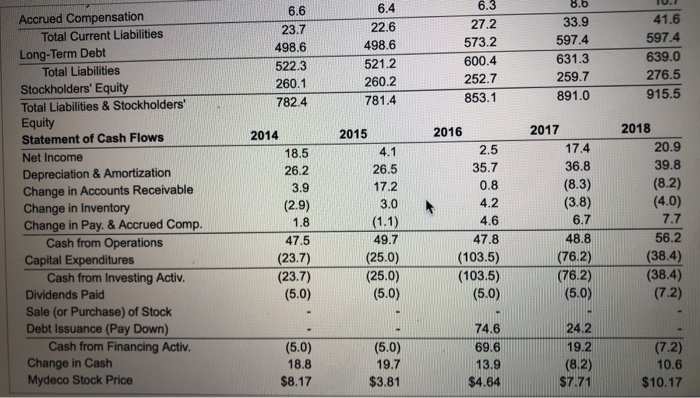
Consider the financial statement data and stock price data for Mydeco Corp. B Click the icon to view the financial statement and stock price data. a. By what percentage did Mydeco's revenues grow each year from 2015 to 2018? b. By what percentage did net income grow each year? c. Why might the growth rates of revenues and net income differ? a. By what percentage did Mydeco's revenues grow each year from 2015 to 2018? The revenues growth for year 2015 is %. (Round to two decimal places.) Data Table 2014-2018 Financial Statement Data and Stock Price Data for Mydeco Corp. (All data as of fiscal year end; in $ millions) Income Statement 2014 2015 2016 2017 Revenue 400.7 368.1 422.5 513.9 Cost of Goods Sold (184.7) (176.6) (207.6) (250.4) Gross Profit 216.0 191.5 214.9 263.5 Sales and Marketing (64.9) (65.4) (83.9) (97.1) Administration (61.0) (59.8) (58.3) (64.8) Depreciation & Amortization (26.2) (26.5) (35.7) (36.8) EBIT 63.9 39.8 37.0 64.8 Interest Income (Expense) (35.5) (33.5) (33.1) (38.1) Pretax Income 28.4 6.3 3.9 26.7 Income Tax (9.9) (2.2) (1.4) (9.3) Net Income 18.5 4.1 2.5 17.4 Shares Outstanding (millions) 55.1 55.1 55.1 55.1 Earnings per Share $0.34 $0.07 $0.05 $0.32 Balance Sheet 2014 2015 2016 2017 Assets Cash 49.1 68.8 82.7 74.5 Accounts Receivable 87.6 70.4 69.6 77.9 Inventory 35.3 32.3 28.1 31.9 Total Current Assets 172.0 171.5 180.4 184.3 2018 603.4 (291.6) 311.8 (123.7) (78.1) (39.8) 70.2 (38.1) 32.1 (11.2) 20.9 55.1 $0.38 2018 85.1 86.1 35.9 207.1 Print Done i Data Table 172.0 248.6 361.8 782.4 171.5 248.1 361.8 781.4 180.4 310.9 361.8 853.1 184.3 344.9 361.8 891.0 207.1 346.6 361.8 915.5 17.1 6.6 Total Current Assets Net Property, Plant & Equipment Goodwill & Intangibles Total Assets Liabilities & Stockholders' Equity Accounts Payable Accrued Compensation Total Current Liabilities Long-Term Debt Total Liabilities Stockholders' Equity Total Liabilities & Stockholders' Equity Statement of Cash Flows Net Income Depreciation & Amortization Change in Accounts Receivable Change in Inventory Change in Pay. & Accrued Comp. Cash from Operations Capital Expenditures Cash from Investing Activ. Dividends Paid 23.7 498.6 522.3 260.1 782,4 16.2 6.4 22.6 498.6 521.2 260.2 781.4 20.9 6.3 27.2 573.2 600.4 252.7 853.1 25.3 8.6 33.9 597.4 631.3 259.7 891.0 30.9 10.7 41.6 597.4 639.0 276.5 915.5 2016 2.5 2014 18.5 26.2 3.9 (2.9) 1.8 47.5 (23.7) (23.7) (5.0) 2015 4.1 26.5 17.2 3.0 (1.1) 49.7 (25.0) (25.0) (5.01 35.7 0.8 4.2. 4.6 47.8 (103.5) (103.5) 2017 17.4 36.8 (8.3) (3.8) 6.7 48.8 (76.2) (76.2) (5.0) 2018 20.9 39.8 (8.2) (4.0) 7.7 56.2 (38.4) (38.4) (7.21 (5.0) 8.6 6.6 23.7 498.6 522.3 260.1 782.4 6.4 22.6 498.6 521.2 260.2 781.4 6.3 27.2 573.2 600.4 252.7 853.1 33.9 597.4 631.3 259.7 891.0 41.6 597.4 639.0 276.5 915.5 Accrued Compensation Total Current Liabilities Long-Term Debt Total Liabilities Stockholders' Equity Total Liabilities & Stockholders' Equity Statement of Cash Flows Net Income Depreciation & Amortization Change in Accounts Receivable Change in Inventory Change in Pay. & Accrued Comp. Cash from Operations Capital Expenditures Cash from Investing Activ. Dividends Paid Sale (or Purchase) of Stock Debt Issuance (Pay Down) Cash from Financing Activ. Change in Cash Mydeco Stock Price 2014 18.5 26.2 3.9 (2.9) 1.8 47.5 (23.7) (23.7) (5.0) 2015 4.1 26.5 17.2 3.0 (1.1) 49.7 (25.0) (25.0) (5.0) 2016 2.5 35.7 0.8 4.2 4.6 47.8 (103.5) (103.5) (5.0) 2017 17.4 36.8 (8.3) (3.8) 6.7 48.8 (76.2) (76.2) (5.0) 2018 20.9 39.8 (8.2) (4.0) 7.7 56.2 (38.4) (38.4) (7.2) 74.6 (5.0) 18.8 $8.17 (5.0) 19.7 $3.81 69.6 13.9 $4.64 24.2 19.2 (8.2) $7.71 (7.2) 10.6 $10.17