

Question
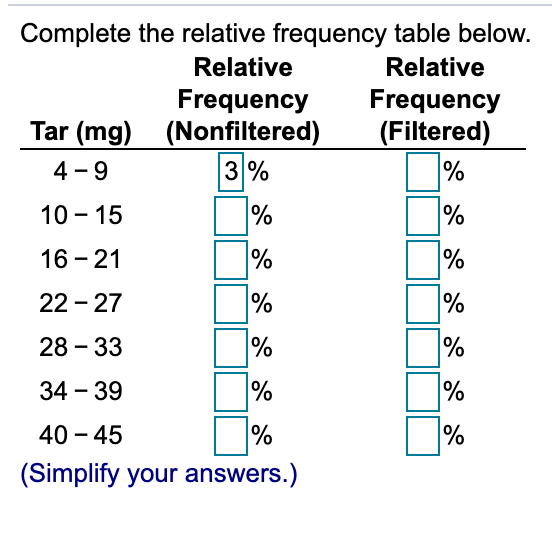
Construct one table that includes relative frequencies based on the frequency distributions shown?below, then compare the amounts of tar in nonfiltered and filtered cigarettes. Do
Construct one table that includes relative frequencies based on the frequency distributions shown?below, then compare the amounts of tar in nonfiltered and filtered cigarettes. Do the cigarette filters appear to be?effective? (Hint: The filters reduce the amount of tar ingested by the?smoker.)
Step by Step Solution
There are 3 Steps involved in it
Step: 1

Get Instant Access to Expert-Tailored Solutions
See step-by-step solutions with expert insights and AI powered tools for academic success
Step: 2

Step: 3
Ace Your Homework with AI
Get the answers you need in no time with our AI-driven, step-by-step assistance
Get Started
Linear Algebra With Applications
Authors: Gareth Williams, Williams
9th Edition
1284120104, 9781284120103