Answered step by step
Verified Expert Solution
Question
1 Approved Answer
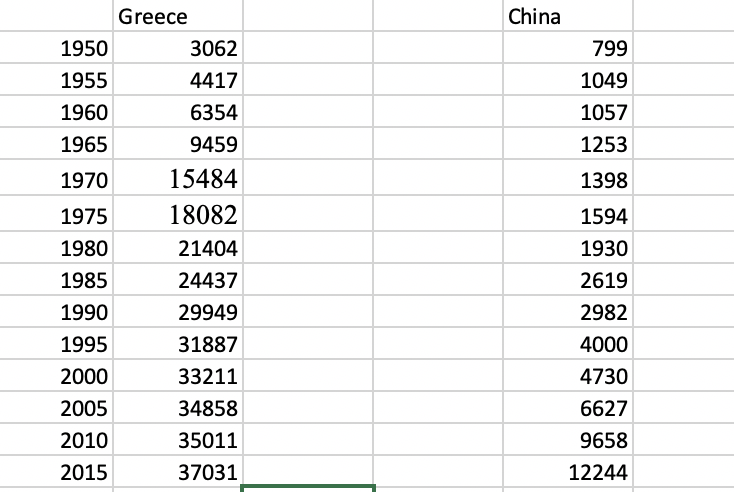
Construct two plots of the data in Problem 2. a) Plot GDP per capita for China and Greece as two lines on the same graph
Construct two plots of the data in Problem 2. a) Plot GDP per capita for China and Greece as two lines on the same graph in levels (use the actual values given and label each line). b) Plot GDP per capita for China and Greece as two lines on a ratio scale graph. You should first calculate GDP per capita for China for each year t as a ratio of GDP per capita for China in 1950, and similarly, for Japan.

Step by Step Solution
There are 3 Steps involved in it
Step: 1

Get Instant Access to Expert-Tailored Solutions
See step-by-step solutions with expert insights and AI powered tools for academic success
Step: 2

Step: 3

Ace Your Homework with AI
Get the answers you need in no time with our AI-driven, step-by-step assistance
Get Started


