

Answered step by step
Verified Expert Solution
Question
1 Approved Answer
create the graph 1. Open the file Final Exam Template. 2. Enter the weights in column B (enter the weights as decimals - Percentages given
create the graph 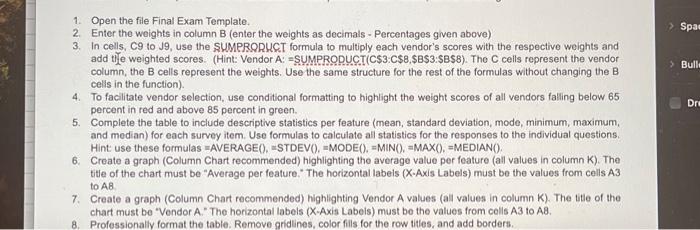
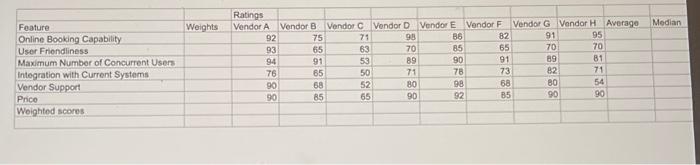
1. Open the file Final Exam Template. 2. Enter the weights in column B (enter the weights as decimals - Percentages given above) 3. In cells, C9 to J9, use the SUMPRORUCT formula to multiply each vendor's scores with the respective weights and add the weighted scores. (Hint: Vendor A: = SUMPRODUCT(C\$3:C\$8,\$BS3:\$BS8). The C cells represent the vendor column, the B cells represent the weights. Use the same structure for the rest of the formulas without changing the B cells in the function). 4. To facilitate vendor selection, use conditional formatting to highlight the weight scores of all vendors falling below 65 percent in red and above 85 percent in green. 5. Complete the table to include descriptive statistics per feature (mean, standard deviation, mode, minimum, maximum, and median) for each survey item. Use formulas to calculate all statistics for the responses to the individual questions. 6. Create a graph (Column Chart recommended) highlighting the average value per feature (all values in column K ). The title of the chart must be "Average per feature." The horizontal labels (X-Axis Labels) must be the values from cells A3 to AB. 7. Create a graph (Column Chart recommended) highlighting Vendor A values (all vatues in column K). The title of the chart must be "Vendor A." The horizontal labels (X-Axis Labels) must be the values from cells A3 to A8. 8. Professionally format the table. Remove gridlines, color fills for the row titles, and add borders Step by Step Solution
There are 3 Steps involved in it
Step: 1

Get Instant Access to Expert-Tailored Solutions
See step-by-step solutions with expert insights and AI powered tools for academic success
Step: 2

Step: 3
Ace Your Homework with AI
Get the answers you need in no time with our AI-driven, step-by-step assistance
Get Started
Database Design Query Formulation And Administration Using Oracle And PostgreSQL
Authors: Michael Mannino
8th Edition
1948426951, 978-1948426954