Create this figure in Java:

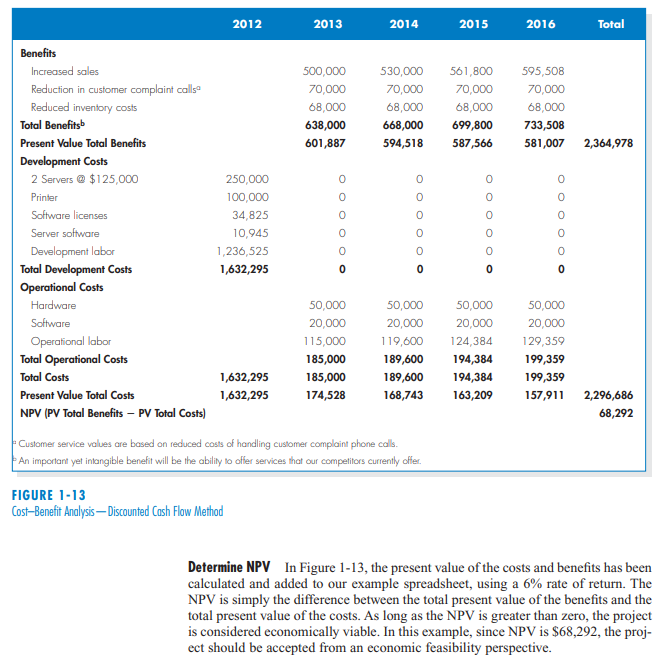
2012 2013 2014 2015 2016 Total 500,000 70,000 68,000 638,000 601,887 530,000 70,000 68,000 668,000 594,518 561,800 70,000 68,000 699,800 587,566 595,508 70,000 68,000 733,508 581,007 2,364,978 0 0 0 0 0 0 0 0 Benefits Increased sales Reduction in customer complaint callse Reduced inventory costs Total Benefits Present Value Total Benefits Development Costs 2 Servers @ $125,000 Printer Software licenses Server software Development labor Total Development Costs Operational Costs Hardware Software Operational labor Total Operational Costs Total Costs Present Value Total Costs NPV (PV Total Benefits - PV Total Costs) 250,000 100,000 34,825 10,945 1,236,525 1,632,295 0 0 0 0 0 0 0 0 0 50,000 20,000 115,000 185,000 185,000 174,528 50,000 20,000 119,600 189,600 189,600 168,743 50,000 20,000 124,384 194,384 194,384 163,209 50,000 20,000 129,359 199,359 199,359 157,911 1,632,295 1,632,295 2,296,686 68,292 Customer service values are based on reduced costs of handling customer complaint phone calls. An important yet intangible benefit will be the ability to offer services that our competitors currently offer. FIGURE 1-13 Cost-Benefit Analysis Discounted Cash Flow Method Determine NPV In Figure 1-13, the present value of the costs and benefits has been calculated and added to our example spreadsheet, using a 6% rate of return. The NPV is simply the difference between the total present value of the benefits and the total present value of the costs. As long as the NPV is greater than zero, the project is considered economically viable. In this example, since NPV is $68,292, the proj- ect should be accepted from an economic feasibility perspective. 2012 2013 2014 2015 2016 Total 500,000 70,000 68,000 638,000 601,887 530,000 70,000 68,000 668,000 594,518 561,800 70,000 68,000 699,800 587,566 595,508 70,000 68,000 733,508 581,007 2,364,978 0 0 0 0 0 0 0 0 Benefits Increased sales Reduction in customer complaint callse Reduced inventory costs Total Benefits Present Value Total Benefits Development Costs 2 Servers @ $125,000 Printer Software licenses Server software Development labor Total Development Costs Operational Costs Hardware Software Operational labor Total Operational Costs Total Costs Present Value Total Costs NPV (PV Total Benefits - PV Total Costs) 250,000 100,000 34,825 10,945 1,236,525 1,632,295 0 0 0 0 0 0 0 0 0 50,000 20,000 115,000 185,000 185,000 174,528 50,000 20,000 119,600 189,600 189,600 168,743 50,000 20,000 124,384 194,384 194,384 163,209 50,000 20,000 129,359 199,359 199,359 157,911 1,632,295 1,632,295 2,296,686 68,292 Customer service values are based on reduced costs of handling customer complaint phone calls. An important yet intangible benefit will be the ability to offer services that our competitors currently offer. FIGURE 1-13 Cost-Benefit Analysis Discounted Cash Flow Method Determine NPV In Figure 1-13, the present value of the costs and benefits has been calculated and added to our example spreadsheet, using a 6% rate of return. The NPV is simply the difference between the total present value of the benefits and the total present value of the costs. As long as the NPV is greater than zero, the project is considered economically viable. In this example, since NPV is $68,292, the proj- ect should be accepted from an economic feasibility perspective


