Question
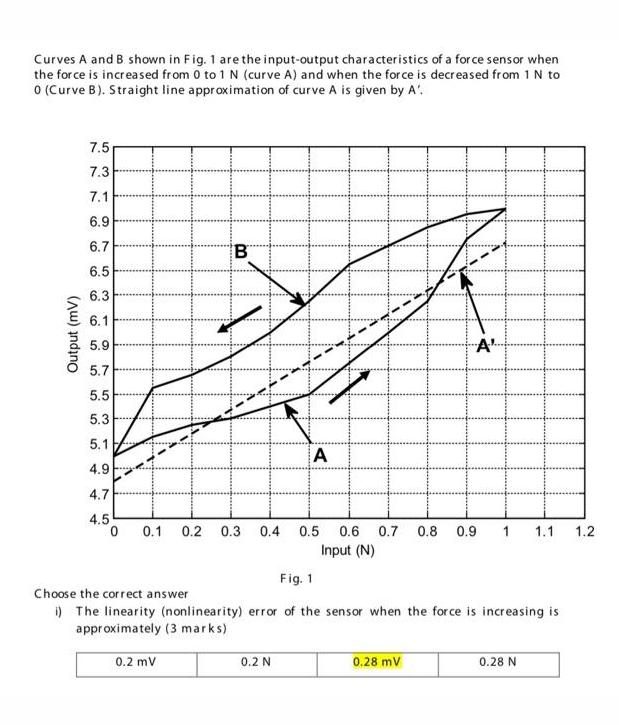
Curves A and B shown in Fig. 1 are the input-output characteristics of a force sensor when the force is increased from 0 to

Curves A and B shown in Fig. 1 are the input-output characteristics of a force sensor when the force is increased from 0 to 1 N (curve A) and when the force is decreased from 1 N to 0 (Curve B). Straight line approximation of curve A is given by A'. Output (mV) 7.5 7.3 7.1 6.9 6.7 6.5 6.3 6.1 5.9 5.7 5.5 5.3 5.1 4.9 4.7 4.5 0 L A V V 0.1 0.2 B 0.3 0.4 A 0.2 N A 0.5 0.6 0.7 0.8 0.9 1 1.1 1.2 Input (N) Fig. 1 Choose the correct answer i) The linearity (nonlinearity) error of the sensor when the force is increasing is approximately (3 marks) 0.2 mV 0.28 mV 0.28 N
Step by Step Solution
3.45 Rating (152 Votes )
There are 3 Steps involved in it
Step: 1
Oll Now 69mv 71mv Linearity error 67m v difference NOTE option Intreasing graph is is u o...
Get Instant Access to Expert-Tailored Solutions
See step-by-step solutions with expert insights and AI powered tools for academic success
Step: 2

Step: 3

Ace Your Homework with AI
Get the answers you need in no time with our AI-driven, step-by-step assistance
Get StartedRecommended Textbook for
Income Tax Fundamentals 2013
Authors: Gerald E. Whittenburg, Martha Altus Buller, Steven L Gill
31st Edition
1111972516, 978-1285586618, 1285586611, 978-1285613109, 978-1111972516
Students also viewed these Finance questions
Question
Answered: 1 week ago
Question
Answered: 1 week ago
Question
Answered: 1 week ago
Question
Answered: 1 week ago
Question
Answered: 1 week ago
Question
Answered: 1 week ago
Question
Answered: 1 week ago
Question
Answered: 1 week ago
Question
Answered: 1 week ago
Question
Answered: 1 week ago
Question
Answered: 1 week ago
Question
Answered: 1 week ago
Question
Answered: 1 week ago
Question
Answered: 1 week ago
Question
Answered: 1 week ago
Question
Answered: 1 week ago
Question
Answered: 1 week ago
Question
Answered: 1 week ago
Question
Answered: 1 week ago
Question
Answered: 1 week ago
Question
Answered: 1 week ago
Question
Answered: 1 week ago
Question
Answered: 1 week ago
Question
Answered: 1 week ago
View Answer in SolutionInn App


