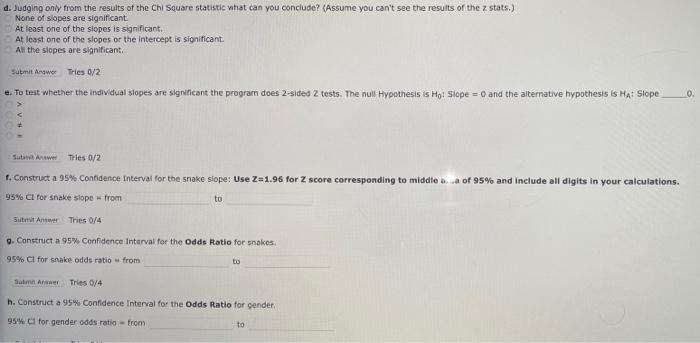
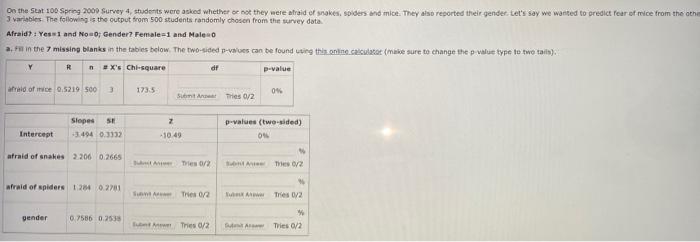
d. Judging only from the results of the Chi Square statistic what can you conclude? (Assume you can't see the results of the z stats.) None of slopes are significant At least one of the slopes is significant. At least one of the slopes or the intercept is significant. All the slopes are significant Submit AnsweeTries 0/2 e. To test whether the individual slopes are significant the program does 2-sided Z tests. The null Hypothesis is Ho! Slope = 0 and the alternative hypothesis is Hat Slope 0 Sutar Tries 0/2 1. Construct a 95% confidence interval for the snake slope: Use Z-1.96 for 2 score corresponding to middle of 95% and include all digits in your calculations. 95% CI for snake slope from to Suosite Tries 0/4 o. Construct a 95% Confidence interval for the Odds Ratio for snakes 95% CI for snake odds ratio from to Hum A Tries 0/4 h. Construct a 95% Confidence interval for the Odds Ratio for gender 95% Cl for gender odds ratio - from to On the Stat 100 Spring 2000 Survey 4, students were asked whether or not they were afraid of snakes, spiders and mice. They also reported their gender. Let's say we wanted to predict fear of mice from the other 3 variables. The following is the output from 500 students randomly chosen from the survey data Afraid?: Yessi and Noo; Gender? Female1 and Males a. ram the 7 missing blanks in the tables below. The two-sided p-wues can be found using thin online calculatot (make sure to change the pile type to two tala). Y R X's Chi-square df p-value afraid of the 0.5219 500 3 1735 OS Som Art Thies 0/2 2 Sloped SE -3494 0.3332 p-values (two-sided) On Intercept 10:49 afraid of snakes 2206 0.2665 Tres 6/2 me 0/2 afraid of spiders 1204 0.2701 Tres 0/2 WA Tres 2 pender 0.7586 0.2538 Tres 0/2 Thies 0/2 d. Judging only from the results of the Chi Square statistic what can you conclude? (Assume you can't see the results of the z stats.) None of slopes are significant At least one of the slopes is significant. At least one of the slopes or the intercept is significant. All the slopes are significant Submit AnsweeTries 0/2 e. To test whether the individual slopes are significant the program does 2-sided Z tests. The null Hypothesis is Ho! Slope = 0 and the alternative hypothesis is Hat Slope 0 Sutar Tries 0/2 1. Construct a 95% confidence interval for the snake slope: Use Z-1.96 for 2 score corresponding to middle of 95% and include all digits in your calculations. 95% CI for snake slope from to Suosite Tries 0/4 o. Construct a 95% Confidence interval for the Odds Ratio for snakes 95% CI for snake odds ratio from to Hum A Tries 0/4 h. Construct a 95% Confidence interval for the Odds Ratio for gender 95% Cl for gender odds ratio - from to On the Stat 100 Spring 2000 Survey 4, students were asked whether or not they were afraid of snakes, spiders and mice. They also reported their gender. Let's say we wanted to predict fear of mice from the other 3 variables. The following is the output from 500 students randomly chosen from the survey data Afraid?: Yessi and Noo; Gender? Female1 and Males a. ram the 7 missing blanks in the tables below. The two-sided p-wues can be found using thin online calculatot (make sure to change the pile type to two tala). Y R X's Chi-square df p-value afraid of the 0.5219 500 3 1735 OS Som Art Thies 0/2 2 Sloped SE -3494 0.3332 p-values (two-sided) On Intercept 10:49 afraid of snakes 2206 0.2665 Tres 6/2 me 0/2 afraid of spiders 1204 0.2701 Tres 0/2 WA Tres 2 pender 0.7586 0.2538 Tres 0/2 Thies 0/2


